Key Takeaways:
- First Pass Yield (FPY) measures the efficiency of a manufacturing process by assessing how many products meet quality standards on the first attempt.
- High FPY indicates a well-optimized process with minimal rework and waste, leading to lower production costs.
- Improving FPY involves identifying and addressing root causes of defects to enhance overall process efficiency.
Quality is perhaps best understood and enforced in high precision component industries such as aerospace and defense, as well as medical device manufacturing. With that said, all manufacturers take into consideration defects, rework, scrap, and their associated costs.
On the forefront of quality metrics, First Pass Yield is a helpful KPI to monitor as it answers a key question for managers: How effective are we at manufacturing quality parts?
What is First Pass Yield?
First Pass Yield (FPY), also known as throughput yield, measures quality units produced as a percentage of the total units that began the process.
There’s a very straightforward reason for manufacturers to track and improve FPY: Reducing waste. When scrap parts are created, or units that require re-work, there is waste generated in several forms:
- Material is wasted if the part must be scrapped
- Labor is wasted from producing scrap or spending time doing re-work
- There is machine tool depreciation for parts that will not generate revenue
- There is opportunity costs in that a quality part could have been created instead
Having an above standard first-pass yield is a competitive advantage. Not only are you using your resources more effectively, but this could lead to several bottom-line benefits:
- Your customers will be happy with the high quality
- You are more likely to hit delivery times
- You can price competitively
FPY is by no means a magic bullet. Focusing on it exclusively without factoring in other metrics could prove harmful. This is why it is important to focus on several metrics (or a composite metric such as OEE) when monitoring production performance.
Plug-and-play Machine Connectivity
The First Pass Yield Formula
Calculating FPY is rather simple, as it simply divides the number of good parts by the total number of parts that began the process, and accounts for the parts that require rework.
Here is what the formula looks like in its most simple form:
FPY = Quality Units / Total Units Produced
To run through an example. Here is the situation:
- Total Units Produced: 100
- Total Units Completed to Part Specification: 95
- Total Units Requiring Rework: 2
Therefore:
- Quality Units: 95 - 2 = 93
- Total Units Produced = 100
First Pass Yield = 93 / 100 = 93%
| Case Study: Learn how BC Machining was able to predict and automatically prevent scrap parts on their Star CNC machines. Read their story. |
How to Improve First Pass Yield
Improving throughput yield requires a variety of factors including understanding the performance of operators, equipment, and processes, ensuring the quality supply of material, and having accurate data to track KPIs.
Let’s discuss some of the practical ways you can approach FPY, and boost your quality program.
Optimize Standard Work
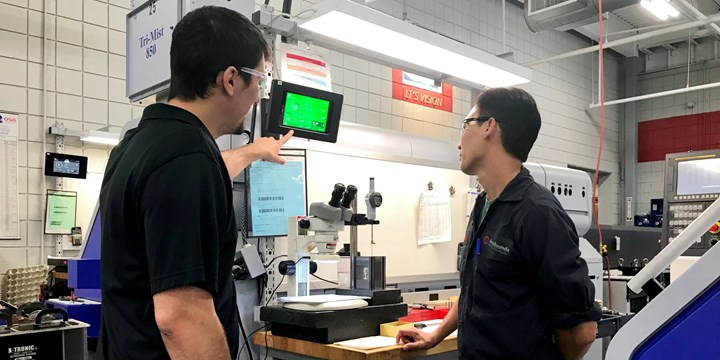
Process optimization is a key component to ensure quality standards are met on the shop floor. By analyzing existing processes, identifying bottlenecks, and visualizing production data, manufacturing engineers and shop floor managers can develop more efficient processes that can also improve quality.
By observing how quality components are manufactured, supervisors can ensure that processes are well-detailed to include not only instructions (see training below) but also key metrics in regards to production time, such as setup and changeovers, cycle times, job times, etc.
Layering quality data on production metrics will help to identify the most accurate job standards required for producing quality units. This data can be used to ensure expectations are appropriate for the first pass yield an organization is aiming for.
Optimizing job standards is a core use case of MachineMetrics. With both production data and quality data (which we touch upon below), job standards can be automatically updated so that existing work standards remain accurate.
Collect Accurate Quality Data in Real-Time
Having a solution in place to automatically collect quality data in real-time is incredibly important to establishing quality benchmarks. Manual collection solutions will not only be time-consuming but error-prone, leading to inaccurate quality standards.
With an automated data collection solution, expectations are kept in line and appropriate goals can be both established and measured. MachineMetrics is able to collect both production data from the machine control as well as key contextual data from operators.
This data is standardized and contextualized in real-time, and can even be used to automatically trigger workflows, such as alerting the quality team.
Using tablets at each machine, operators can categorize the reason in which a part does not reach spec. This provides data on the top reasons that parts are rejected and allows for deeper analysis to determine why these defects are occurring and how they can be addressed.
With appropriate changes in place, such as adjusting a process, first pass yield can be improved.
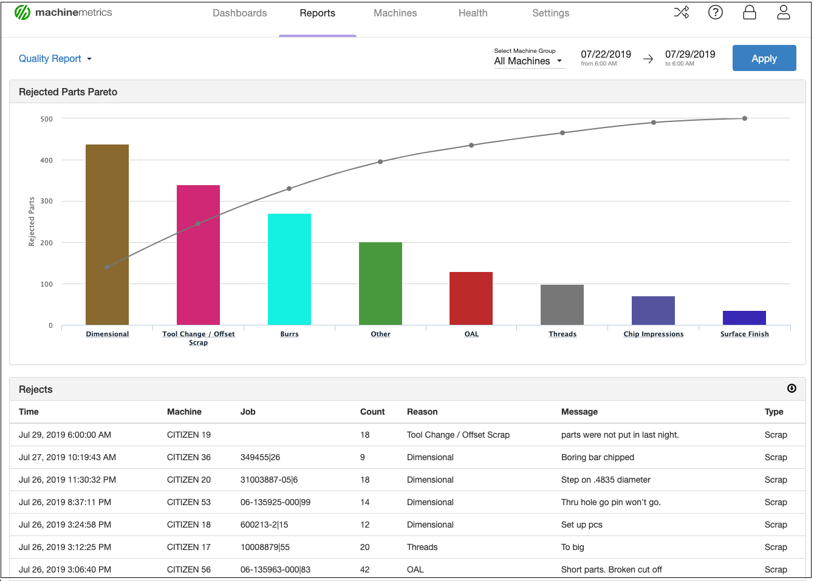
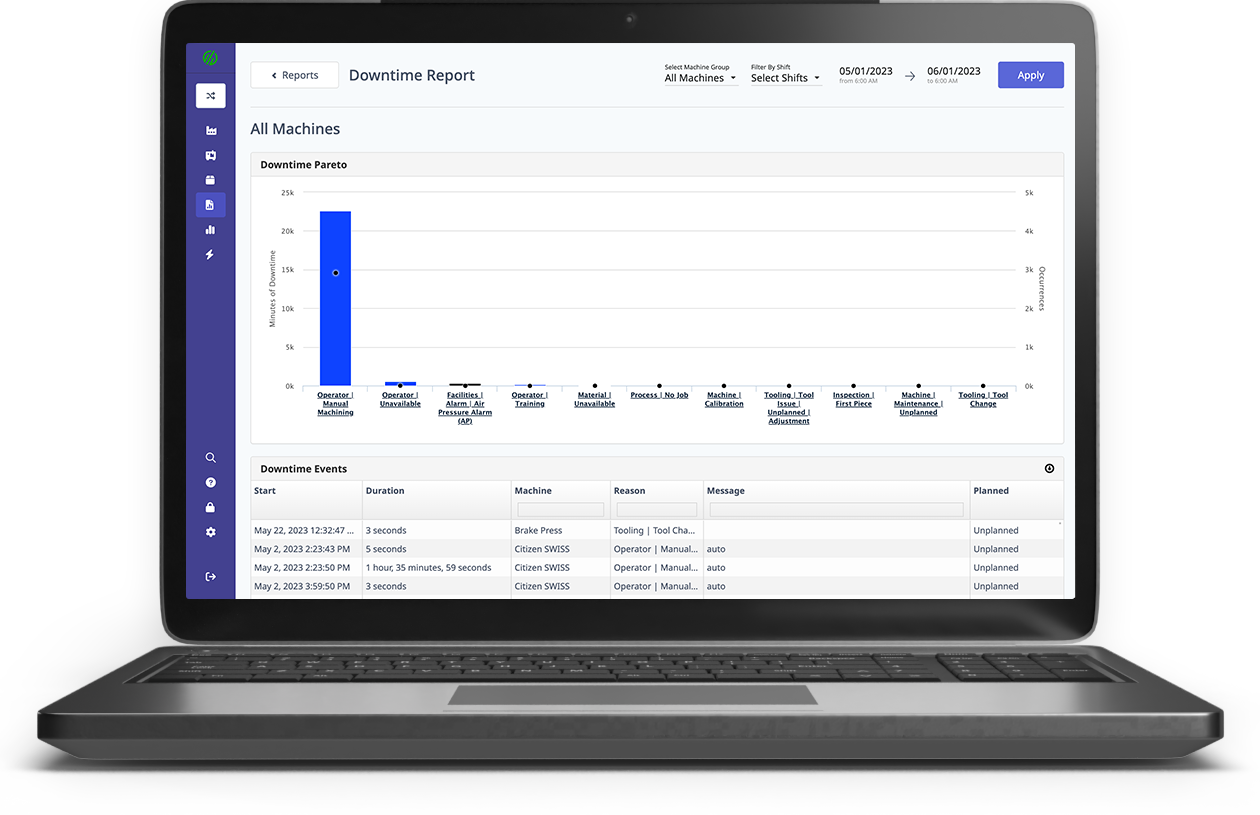
An example of the MachineMetrics Quality Report. With a Pareto chart, it is easy to identify the most common causes of quality issues so that you can begin rolling out process changes to address them.
Monitor Equipment Performance and Health
Collecting machine performance and health data in real-time offers a variety of benefits. Below are just a few that fall under the umbrella of quality.
Real-Time Alerts:
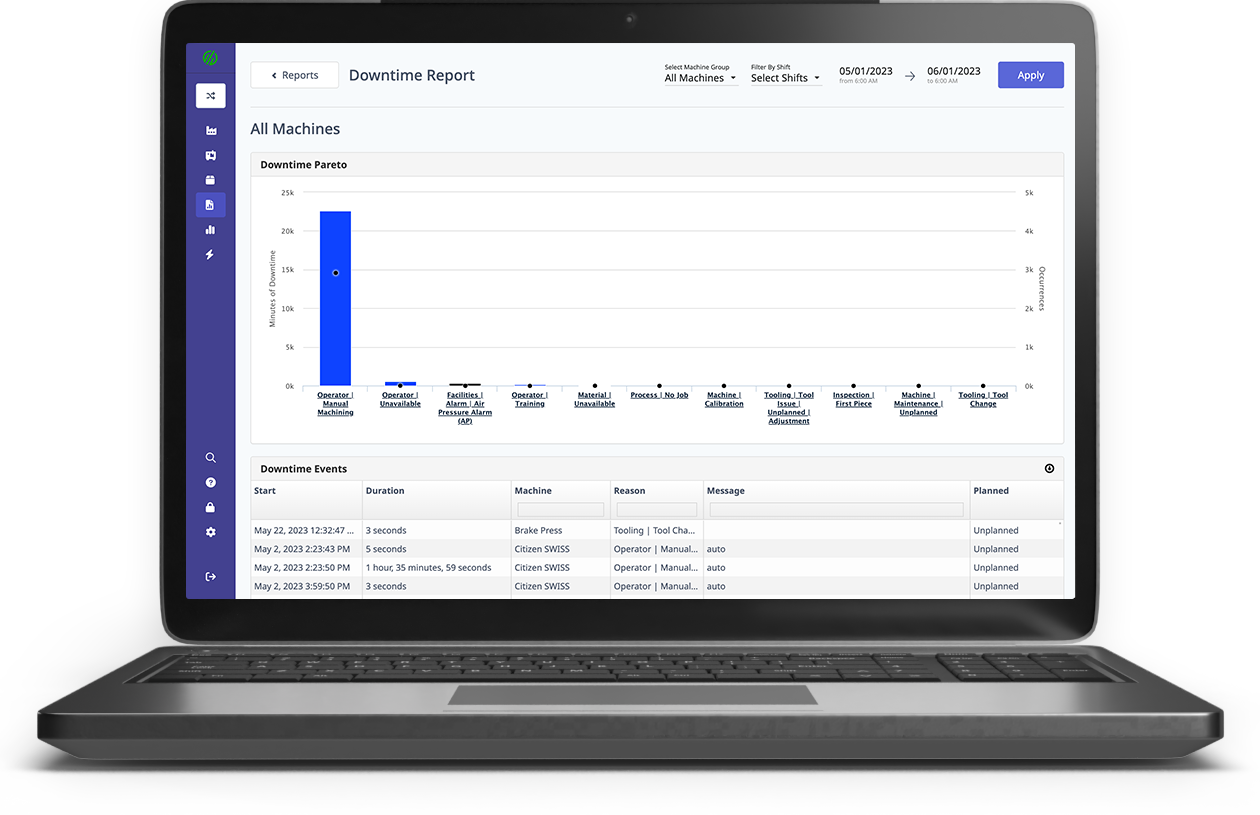
Machine events and thresholds can be set that automatically notify team members. For example, a downtime event may trigger a text message to the shop floor supervisor, or a part quality issue logged by an operator could immediately notify the maintenance team. This ensures issues are resolved as soon as they happen, and can have an immediate impact on first pass quality yield.
Broken Tools and Tool Wear:
When machine tools fail, they generally produce scrap parts that could have been avoided. Sometimes, the machine will continue to run, producing hundreds of parts that will be scrapped. Tool monitoring is a solution that uses tool data to understand the performance of the tool to prevent quality issues from occurring, or at the very least, minimizing their impacts.
Shop Floor Visibility and Control:
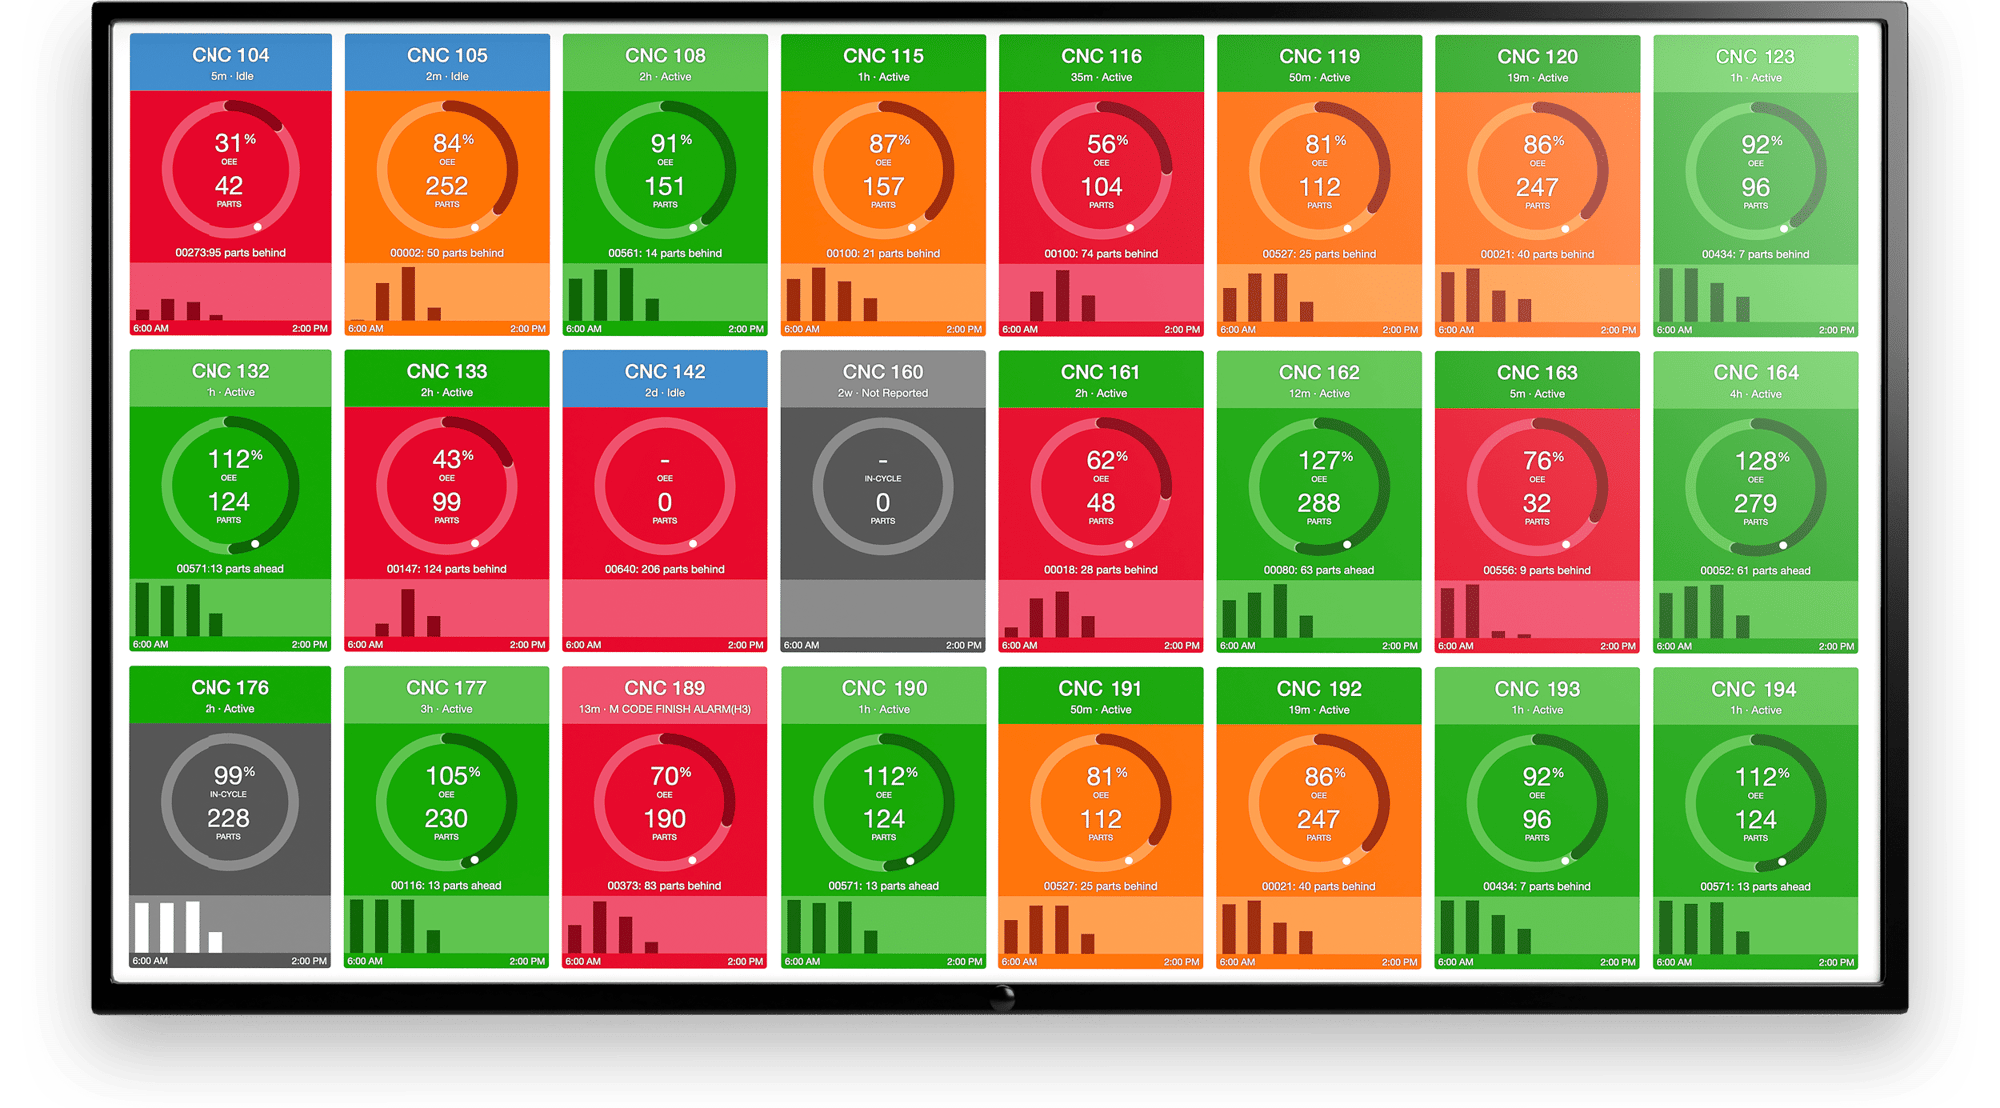
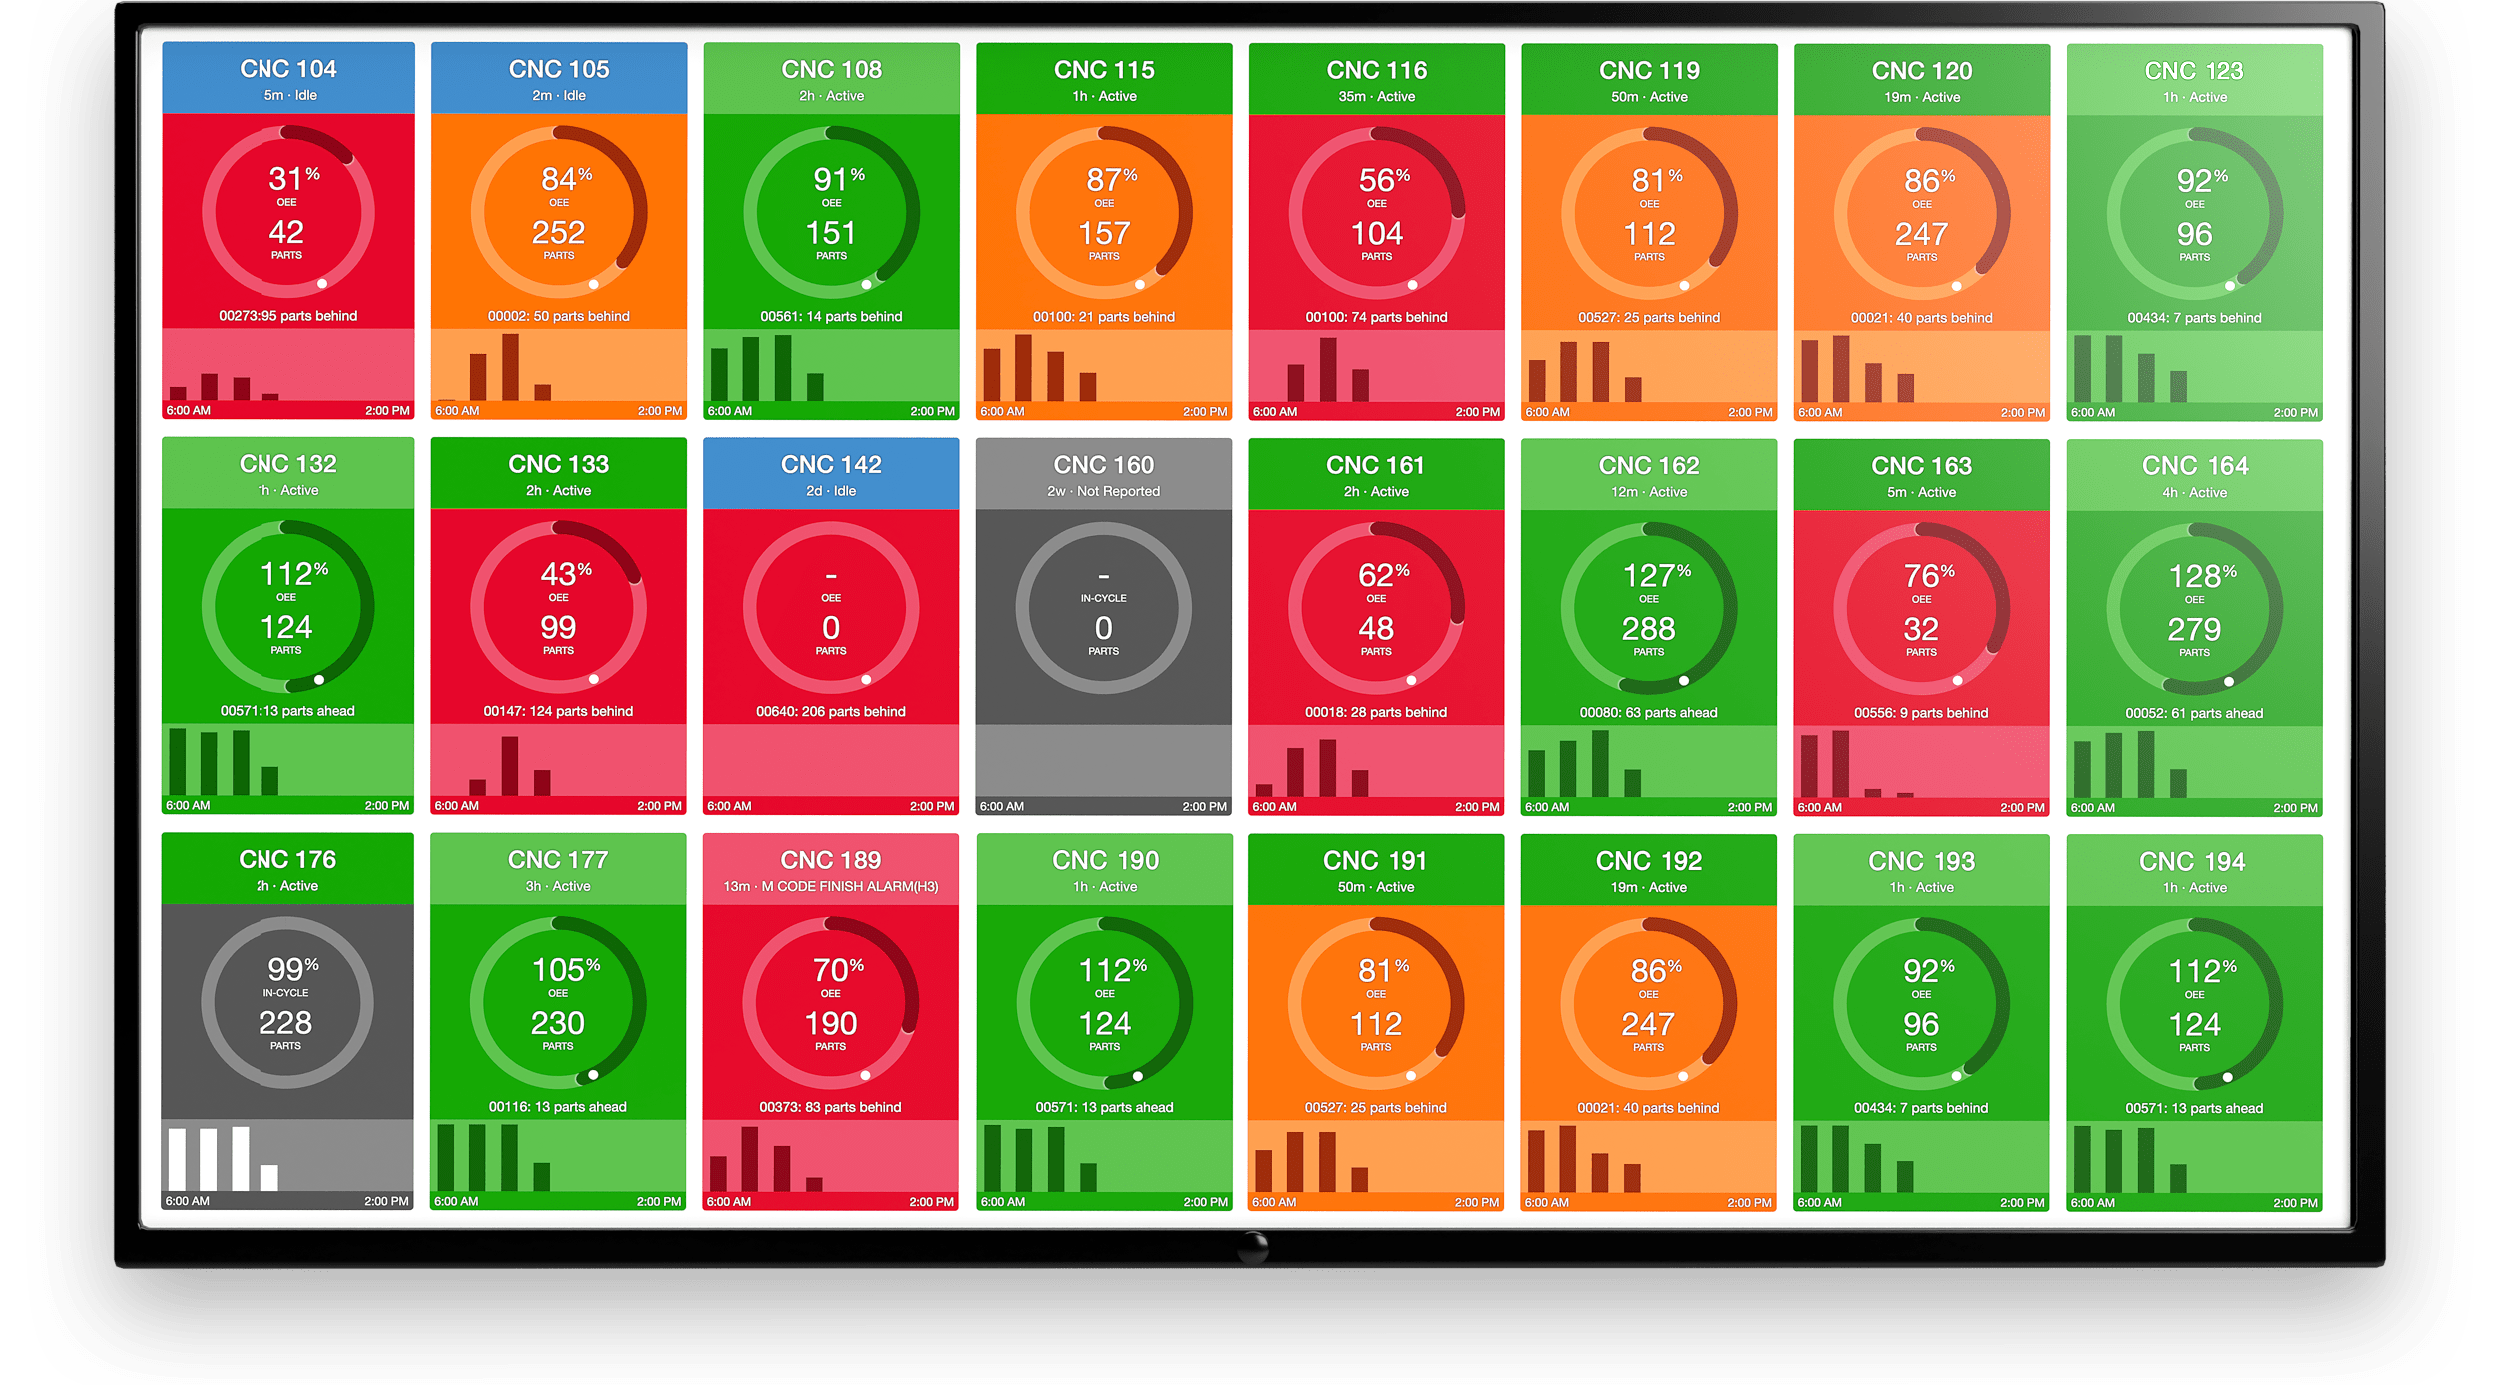
As a manager, having insight into the shop floor with the glance of a dashboard helps you pounce on issues as soon as they happen. Whether alerts are set up or not, shop floor dashboards can easily indicate where machines are falling behind, when machines are down, or when quality standards are being met, giving you the shop floor control every manager hopes for.
Want to See the Platform in Action?
Improve Training Programs and Enable Operators
Your operators are the lifeblood of production and those closest to the machines engaging in work on a daily basis. Enabling them with visibility, instruction, and accountability ensures that individuals can take performance into their own hands.
With accurate production data, processes can be tweaked and fully detailed so that operators can focus more on doing productive work, and less on making many low-value decisions. Further, with accurate job standards, appropriate expectations will be in place so operators feel that goals are attainable.
This allows managers to roll out incentive programs as well as enable operators with fully detailed instructions as well as visibility right from the machine, via operator tablets and shop floor dashboards. In real-time, operators will have a view into where they stand against expected production performance.
Ensure Suppliers are High Quality
One of the most basic components of improving first pass yield is ensuring that the material purchased from suppliers meets quality standards upon arrival.
There are a variety of ways to vet and select quality suppliers, including asking for their relevant certifications, ensuring they have experience in your industry, knowing their capacity potential, talking with other customers, asking for a quote, engaging in an inspection of their supply, etc.
If poor quality material comes through the door, first pass quality yield will only become more of a challenge for your team.
Improving Quality with MachineMetrics
MachineMetrics Industrial Data Platform captures, standardizes, and contextualizes real-time production data and propagates it in pre-built and custom reports and dashboards.
Managers, operators, and various stakeholders across maintenance, production, and quality can take immediate action on data or use historical reports to dive into deeper analysis and process optimization strategies.
Take your quality program to the next level. Learn more about how MachineMetrics reduces scrap, or book a demo with our team today.
Ready to connect your shop floor?
.png?width=1960&height=1300&name=01_comp_Downtime-%26-Quality_laptop%20(1).png)







Comments