Accurate job standards can make or break the operational and financial success of a manufacturer. Lack of real-time validation methods for setup and cycle times leads to poor forecasting and the impact is felt throughout the organization.
In this article, we discuss how manufacturers can use MachineMetrics to easily verify job standards against real performance data and how honing job standards can help you price your parts better and schedule jobs more accurately.
Why is Standardizing Your Jobs and Setup Times Important?
Manufacturers often have standards that go along with the time it takes to make a part as well as the time it takes to set up a job (to make a part). These standards are often set during the design and/or programming phase and are often not kept up-to-date. Since manufacturers sometimes use these standards to base pricing and scheduling, it can cause a discrepancy between the expected job and setup time versus the actual job and setup time.
This leads to a variety of issues that extend throughout the operation:
- Operators are discouraged by unrealistic goals based on expected versus actual rates of production, which are likely overly optimistic
- On-time delivery goals are a struggle to meet as it generally takes longer to complete customer orders
- Profit margins are slimmer than quoted, as pricing is based on the time it takes to complete a given part
By having accurate standards, including jobs, setups, and cycle times, manufacturers have a better overall understanding of the actual expected production performance.
Using this accurate standard as a benchmark, managers can improve machine performance, operator performance, scheduling, and quoting by optimizing cycle times, engaging in a capacity analysis, or identifying opportunities for line balancing.
Using a solution like MachineMetrics, these performance improvements can be tracked in real-time, and job standards can be updated to reflect any changes.
“Having strong, accurate job standards is the foundational layer to driving optimized manufacturing processes, and delivering profitable business outcomes.”
Using MachineMetrics to Optimize Job Standards
The core of job standard optimization is using actual performance data to drive expected job standards, and allowing these standards to be updated continuously via workflows.
MachineMetrics enables this by quickly and easily connecting to manufacturing equipment, contextualizing the data, and providing stakeholders with easy-to-understand reports and dashboards so that standards can be updated according to production data.
Data Sources
MachineMetrics collects both machine and operator data in real-time to unlock production visibility and aggregate accurate job standards that can be updated via workflows.
Machine Data: Our plug-and-play solution ensures that machines can be easily connected and data can be collected directly from PLC's supporting protocols including MTConnect, Fanuc, OPC-UA, UMATI, Mitsubishi, Citizen, Haas, Heidenhain, Siemens Sinumerik, Modbus, and Ethernet IP.
MachineMetrics Edge supports digital and analog I/O for machines without a standard connectivity option to integrate even the most challenging equipment.
Plug-and-play Machine Connectivity
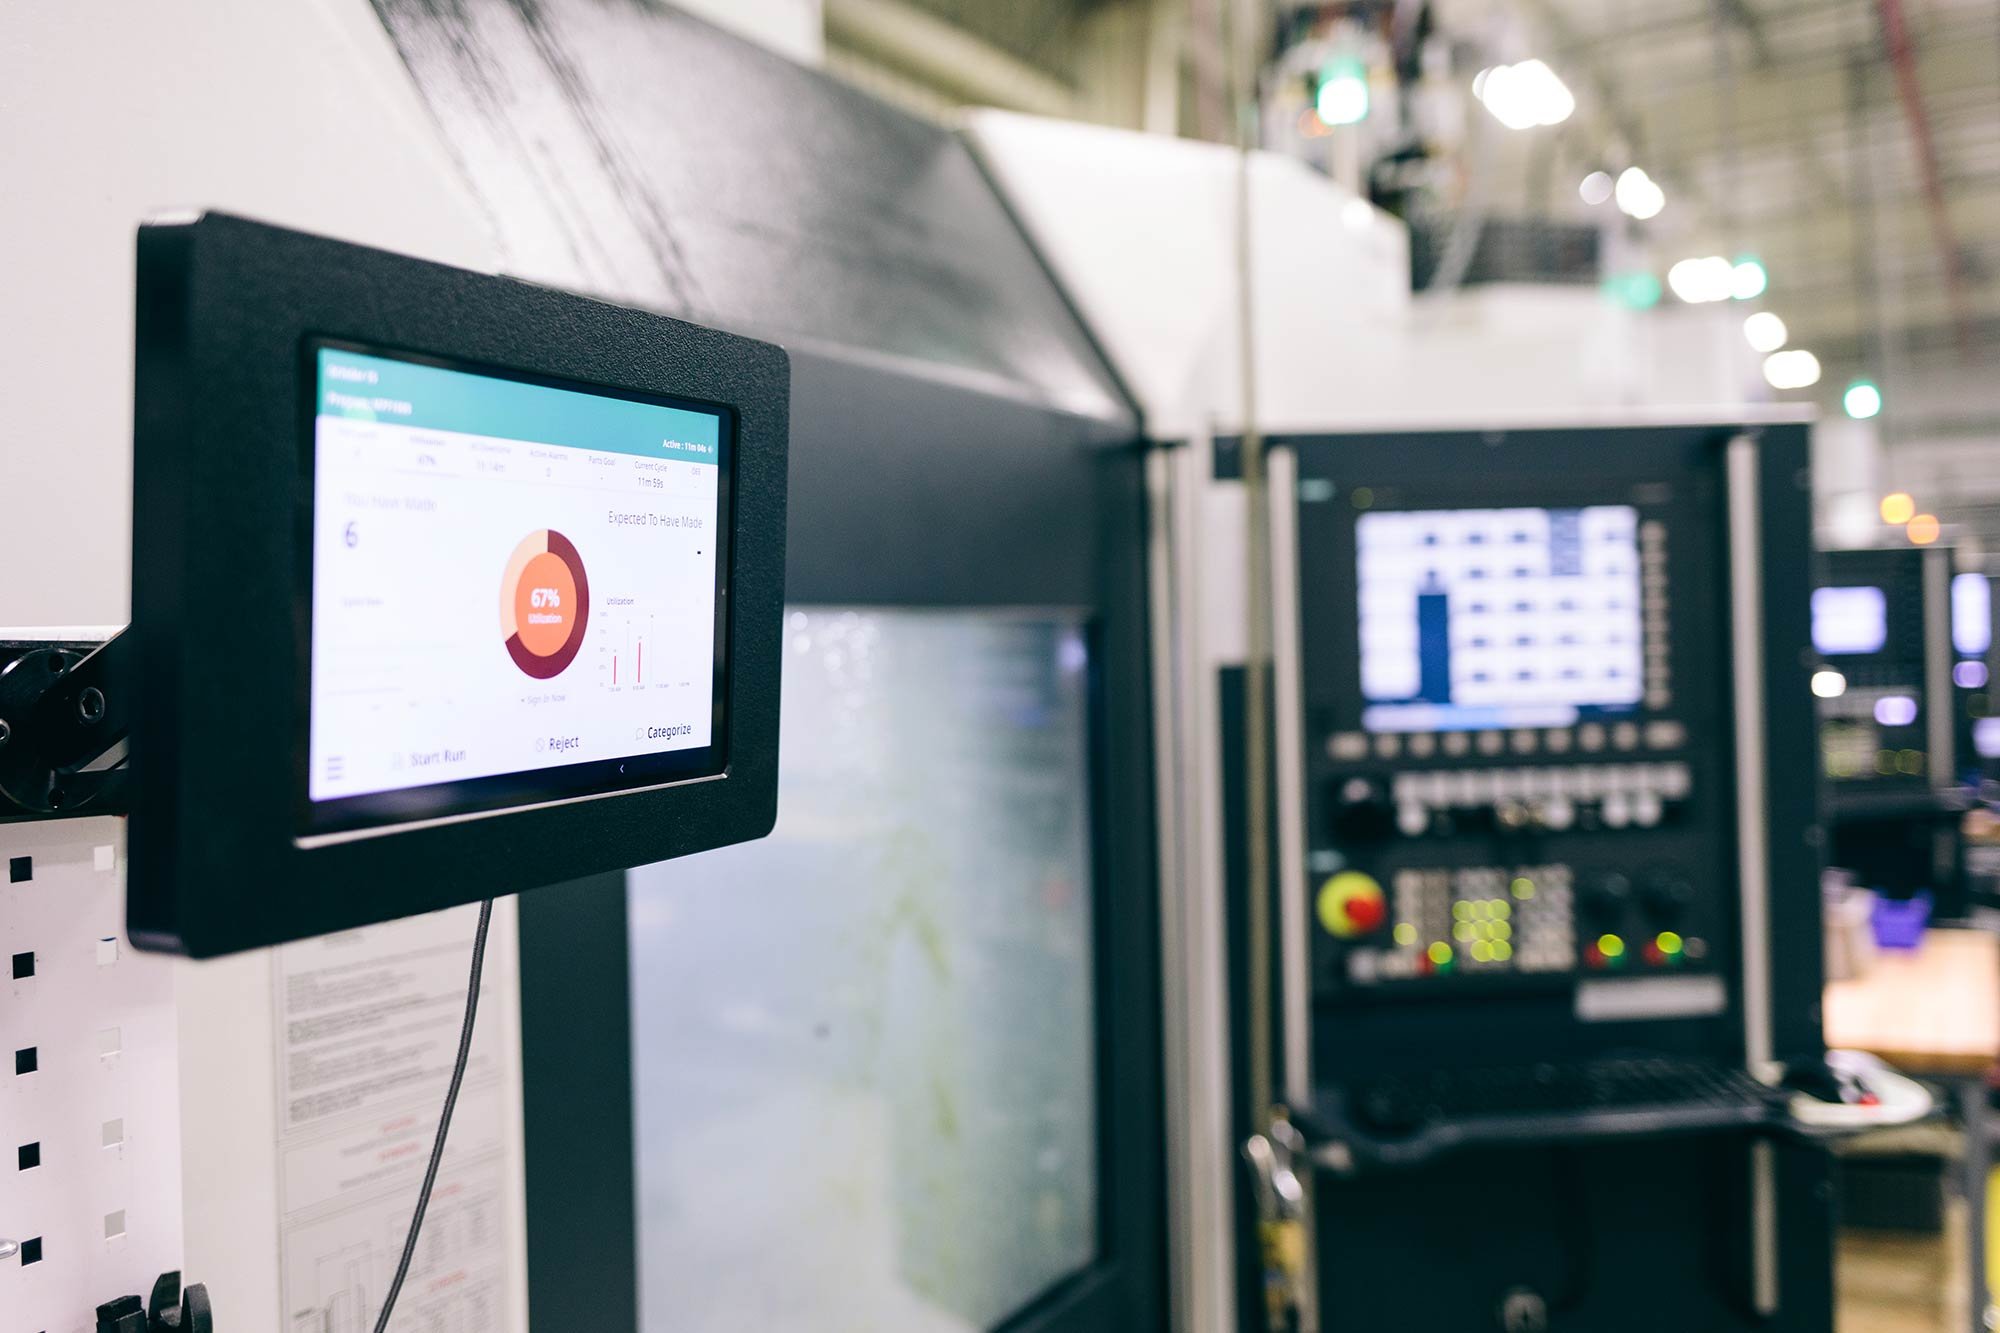
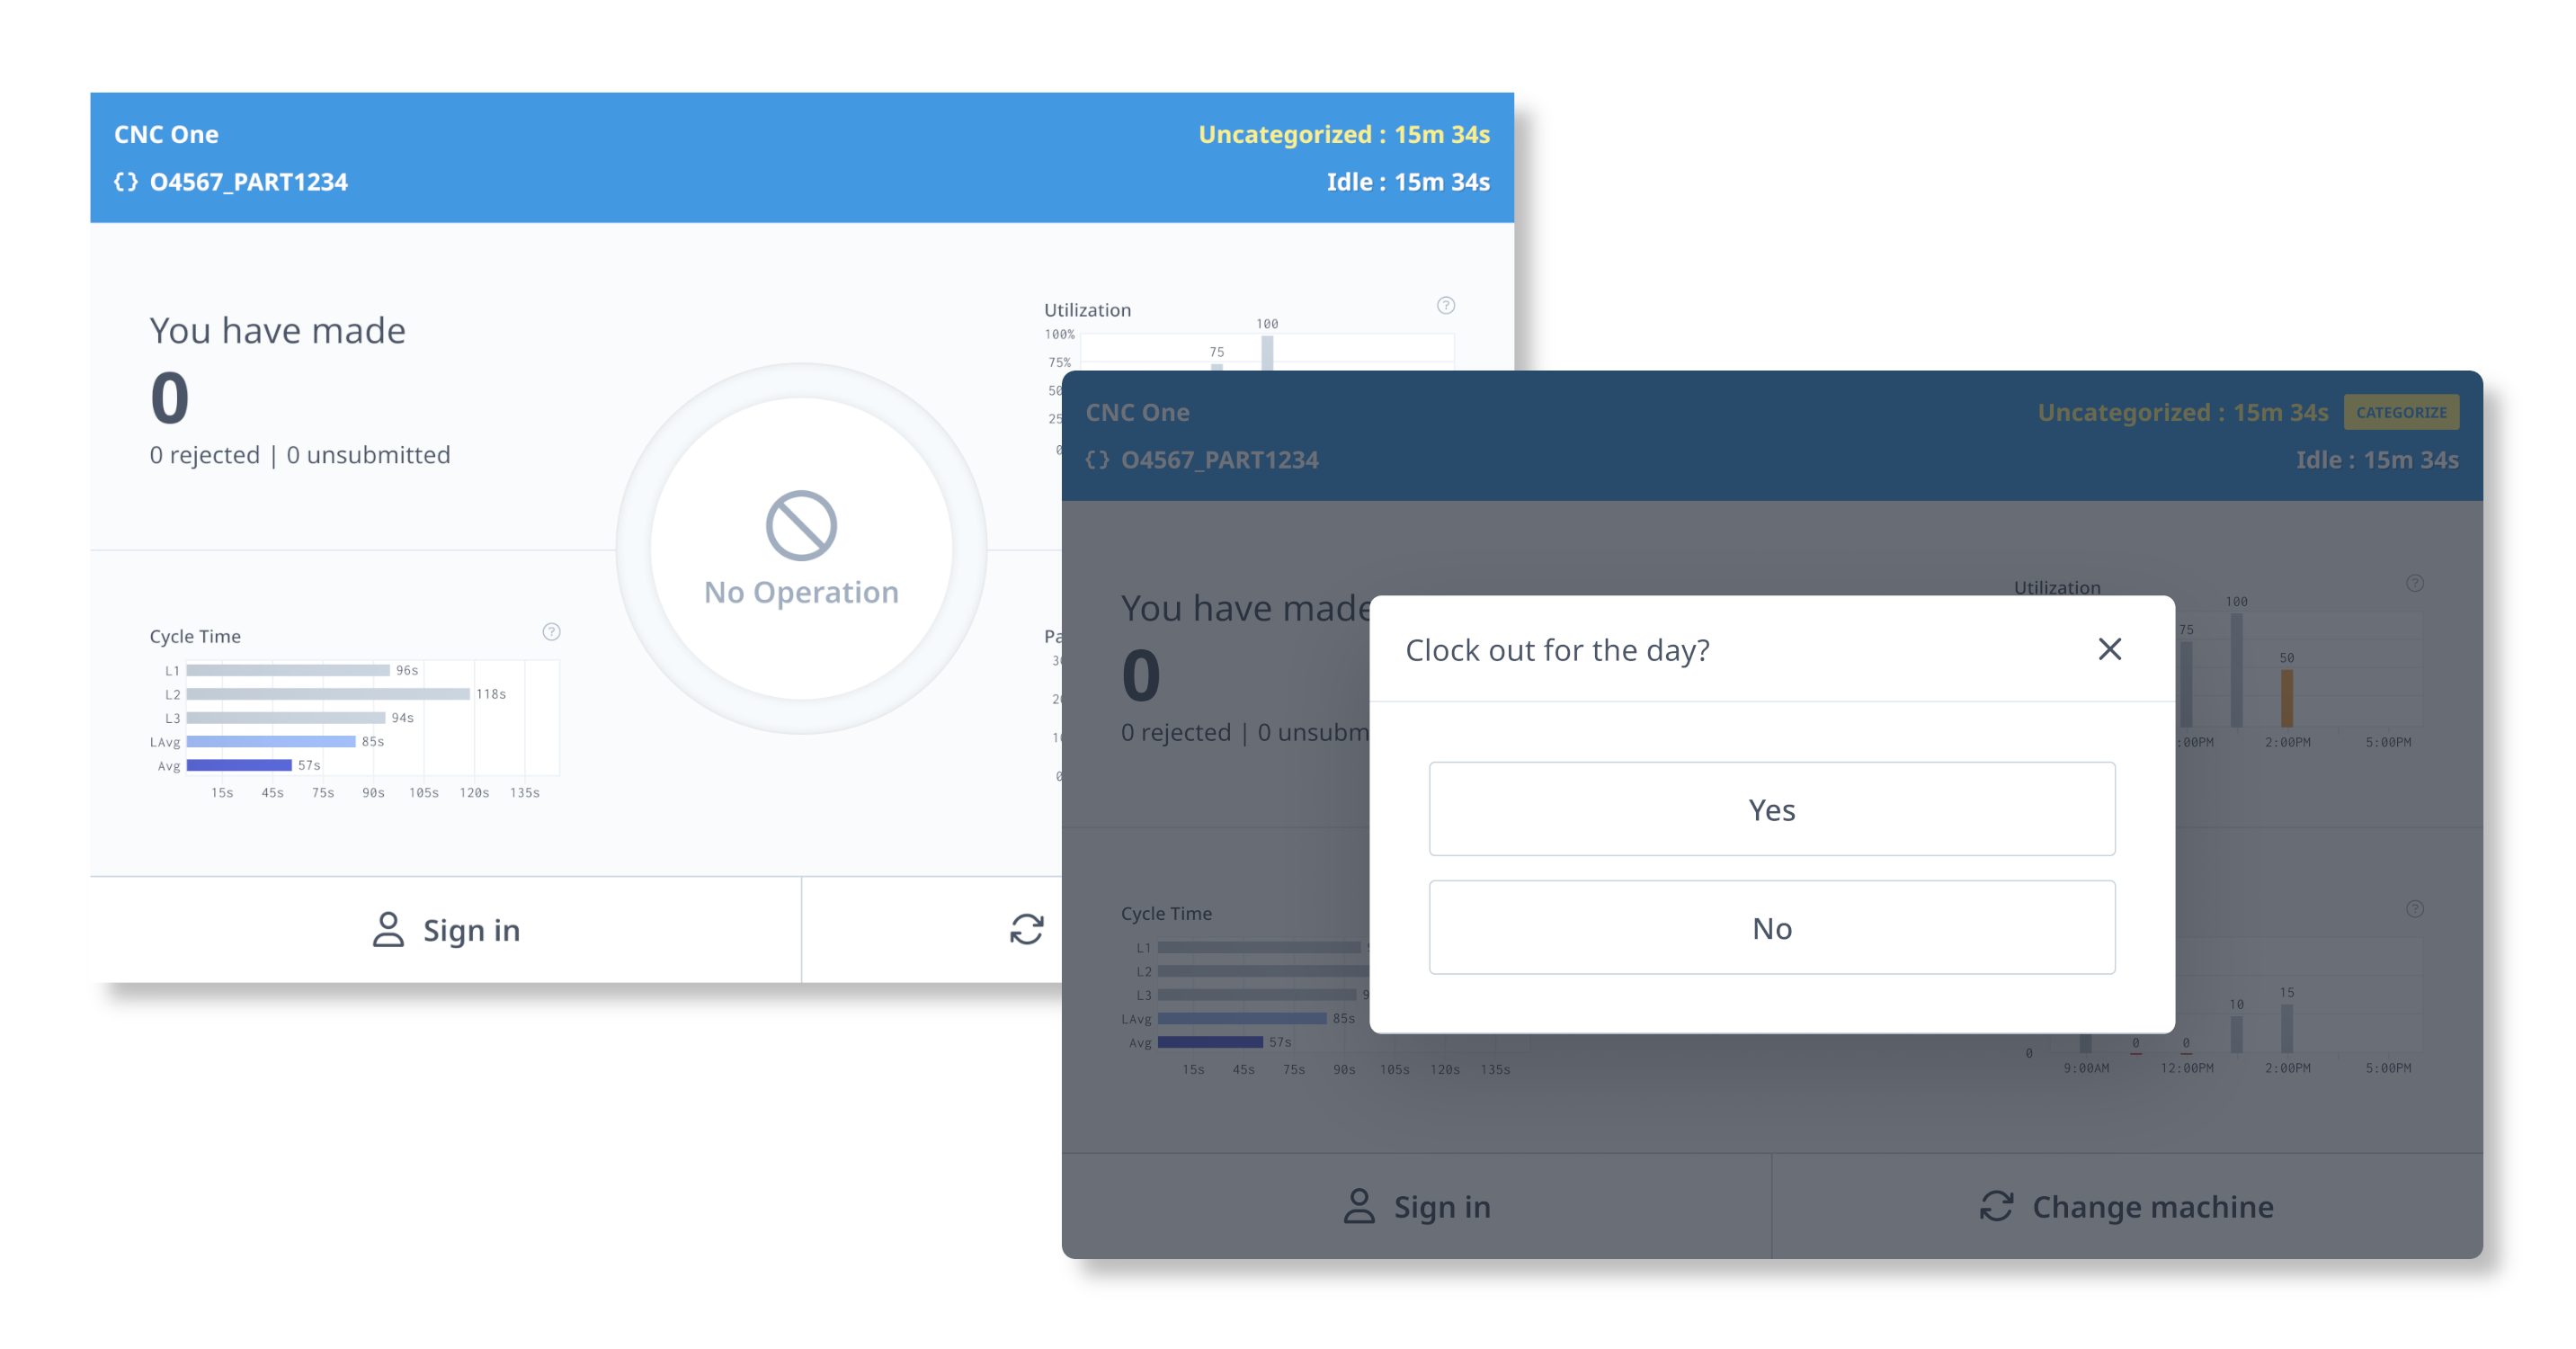
Operator Data: Tablet interfaces are placed at every machine, allowing operators to add human-context to machine data. Operators can categorize downtime, reject a part, and start/stop jobs right from the machine to manage and record quality data.
What Data is Collected?
A variety of information is collected both directly from manufacturing equipment, as well as from operators performing the jobs at machines. This data can be used in both real-time, as well as aggregated for historical analysis to baseline and optimize job standards.
- Setup times
- Cycle times
- Cycle time for every part produced
- Median and mean cycle times for each job run and aggregate
- OEE and performance metrics
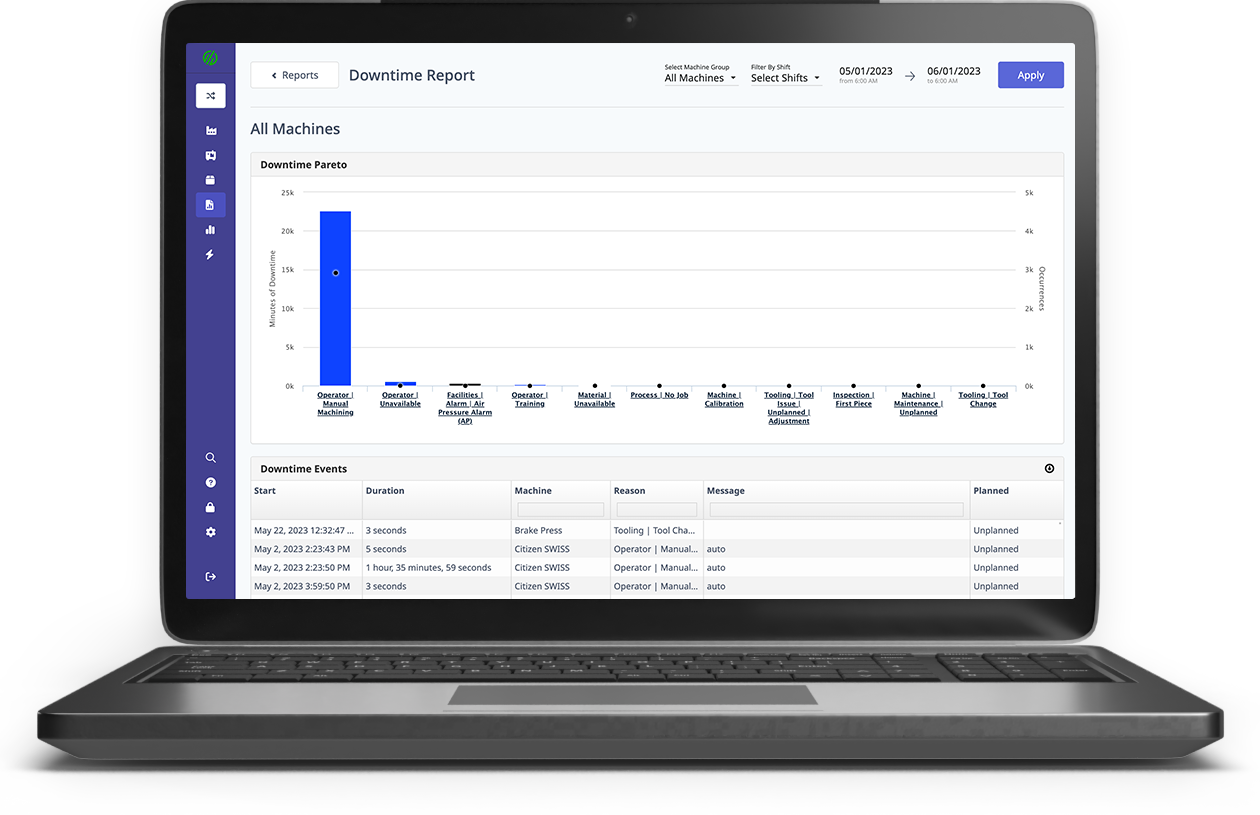
- Downtime and reject reasons associated with job performance
- Job standards, including edits that are made
- Historical job performance
Dashboards and Reports
Production data can be analyzed in pre-built reports and dashboards to monitor and baseline jobs, setups, and cycle times, as well as other key metrics that establish or influence job standards.
Below are some of the pre-built reports you can use within MachineMetrics to analyze and optimize job standards. Keep in mind, you can also customize reports to include any data relevant to your operation.
Production Report
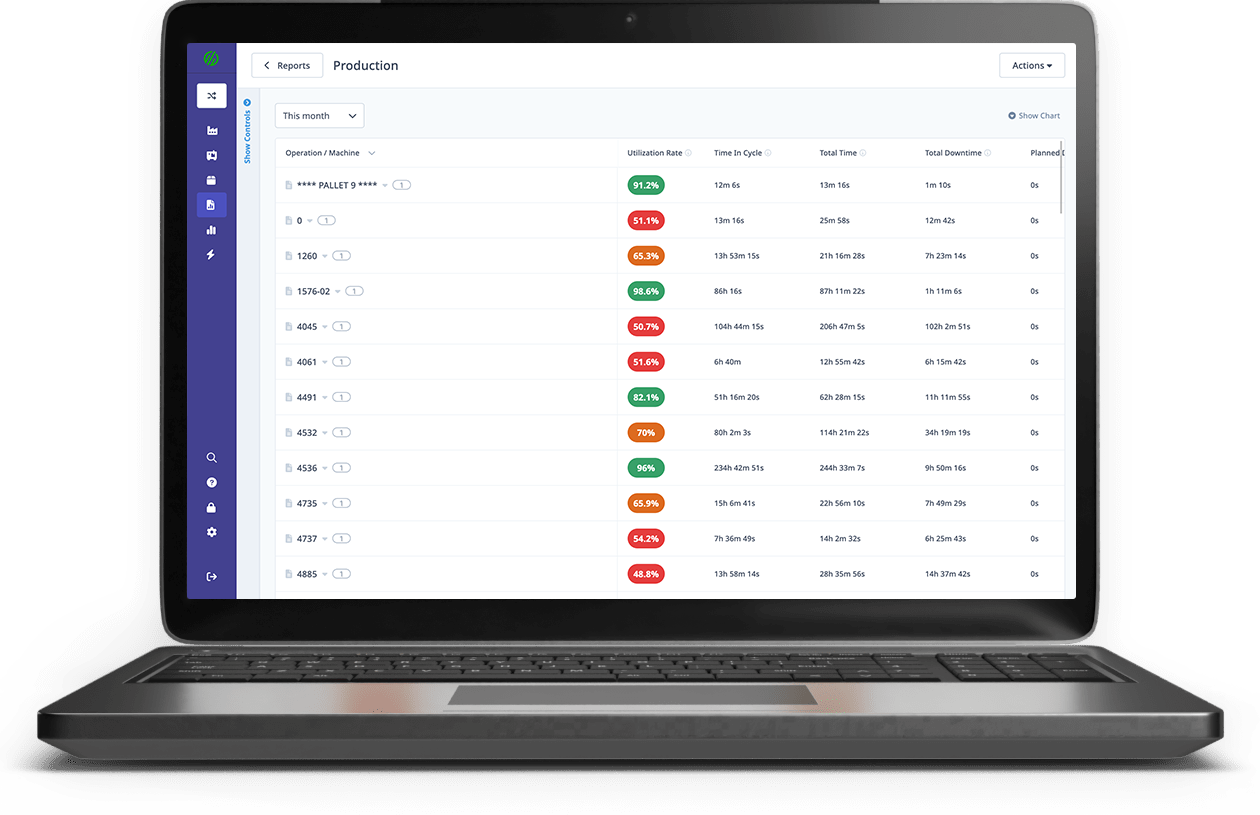
There are a lot of metrics available in the Production Report. When it comes to optimizing your job standards, there are several production efficiency and job run time metrics you will want to ensure are in the report:
Production Efficiency
The metrics available in the Production Report related to machine production efficiency for a completed Job include:
- Production Efficiency
- Total Part Time
- Actual Part Time
- Average PPH
- Ideal PPH
- Expected PPH
- Expected Part Time
- Ideal Part Time
- Total Setup
- Expected Setup
Job Run Times
The metrics available in the Production Report related to machine run times for a completed Job include:
- First Start Time
- Last End Time
Below is an image featuring the production report, as well as a zoomed-in picture featuring some of the key metrics you may consider including in the report:

OEE Report
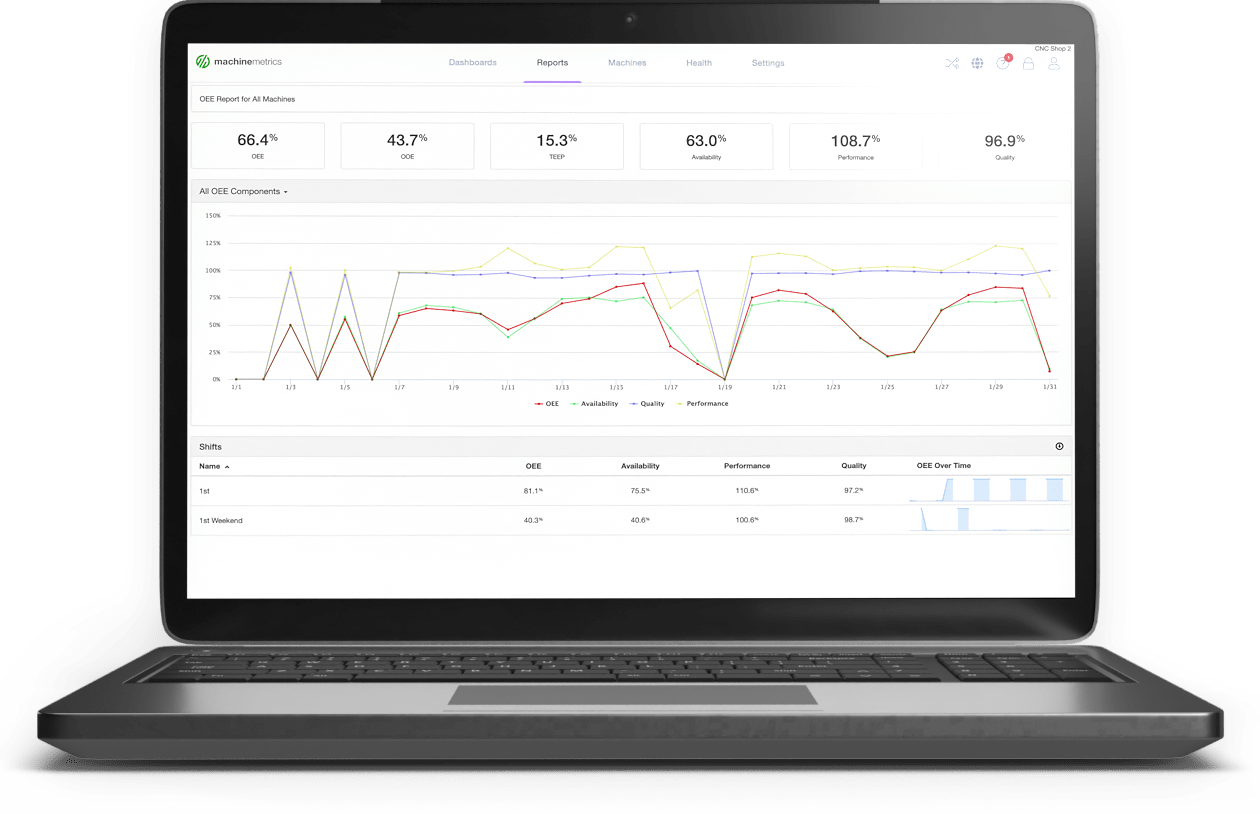
The connection between OEE (Overall Equipment Effectiveness) and job standards is “Performance”, which is one of the three metrics that make up OEE (the others being Availability and Quality).
Performance is represented as a percentage and is a measure of how well you are performing against your job standards.
For the sake of simplicity, if expected cycle times are 1 minute and you machine 60 parts in an hour, your performance will be 100%. However, if you were only able to complete 50 parts in an hour, your performance would be 83%.
Below is a look at the OEE report, as well as a zoomed-in image featuring the metrics at the top of the report:

Current Shift Dashboard
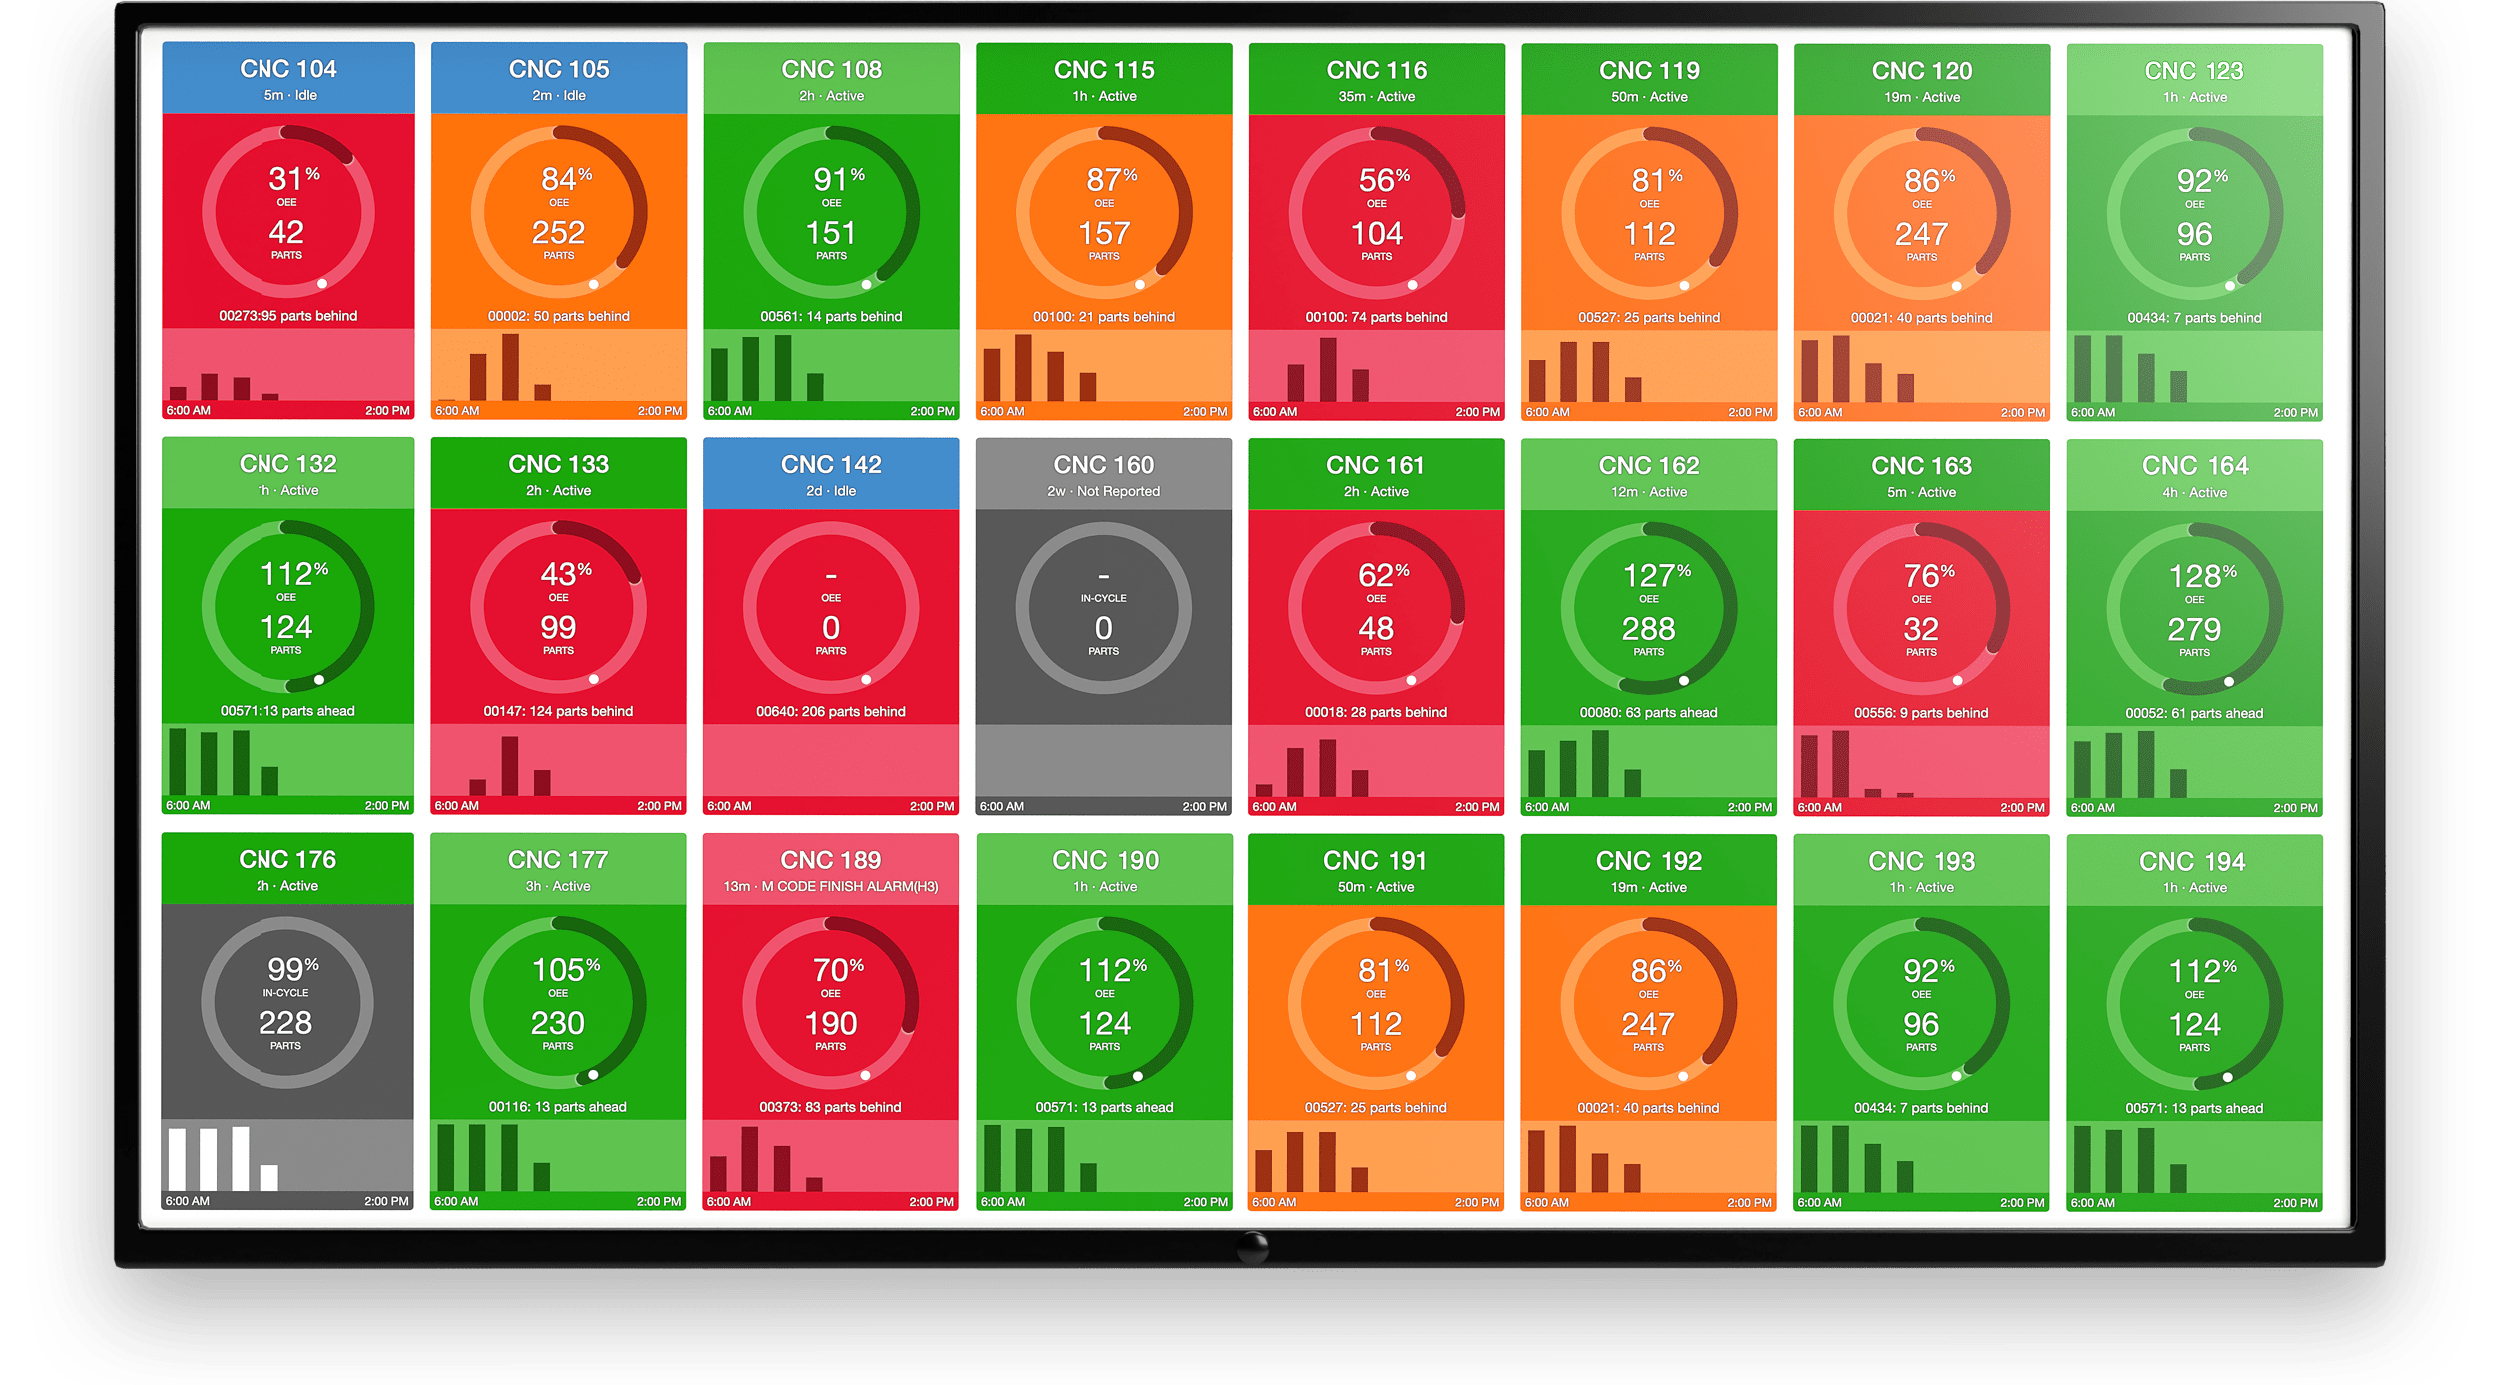
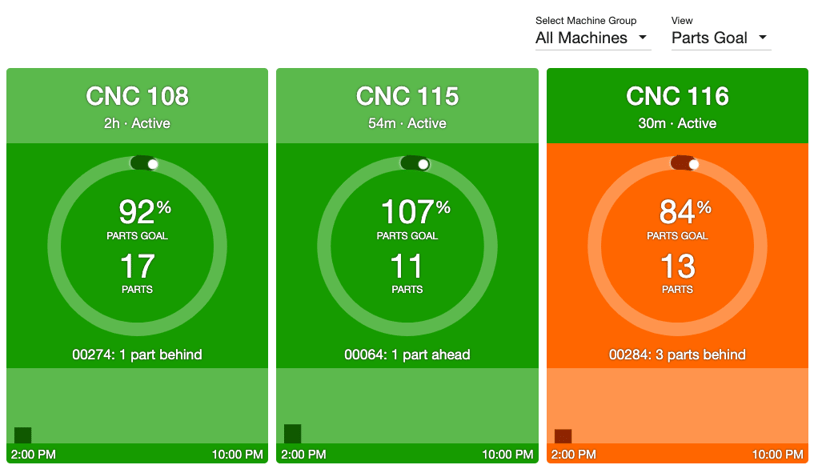
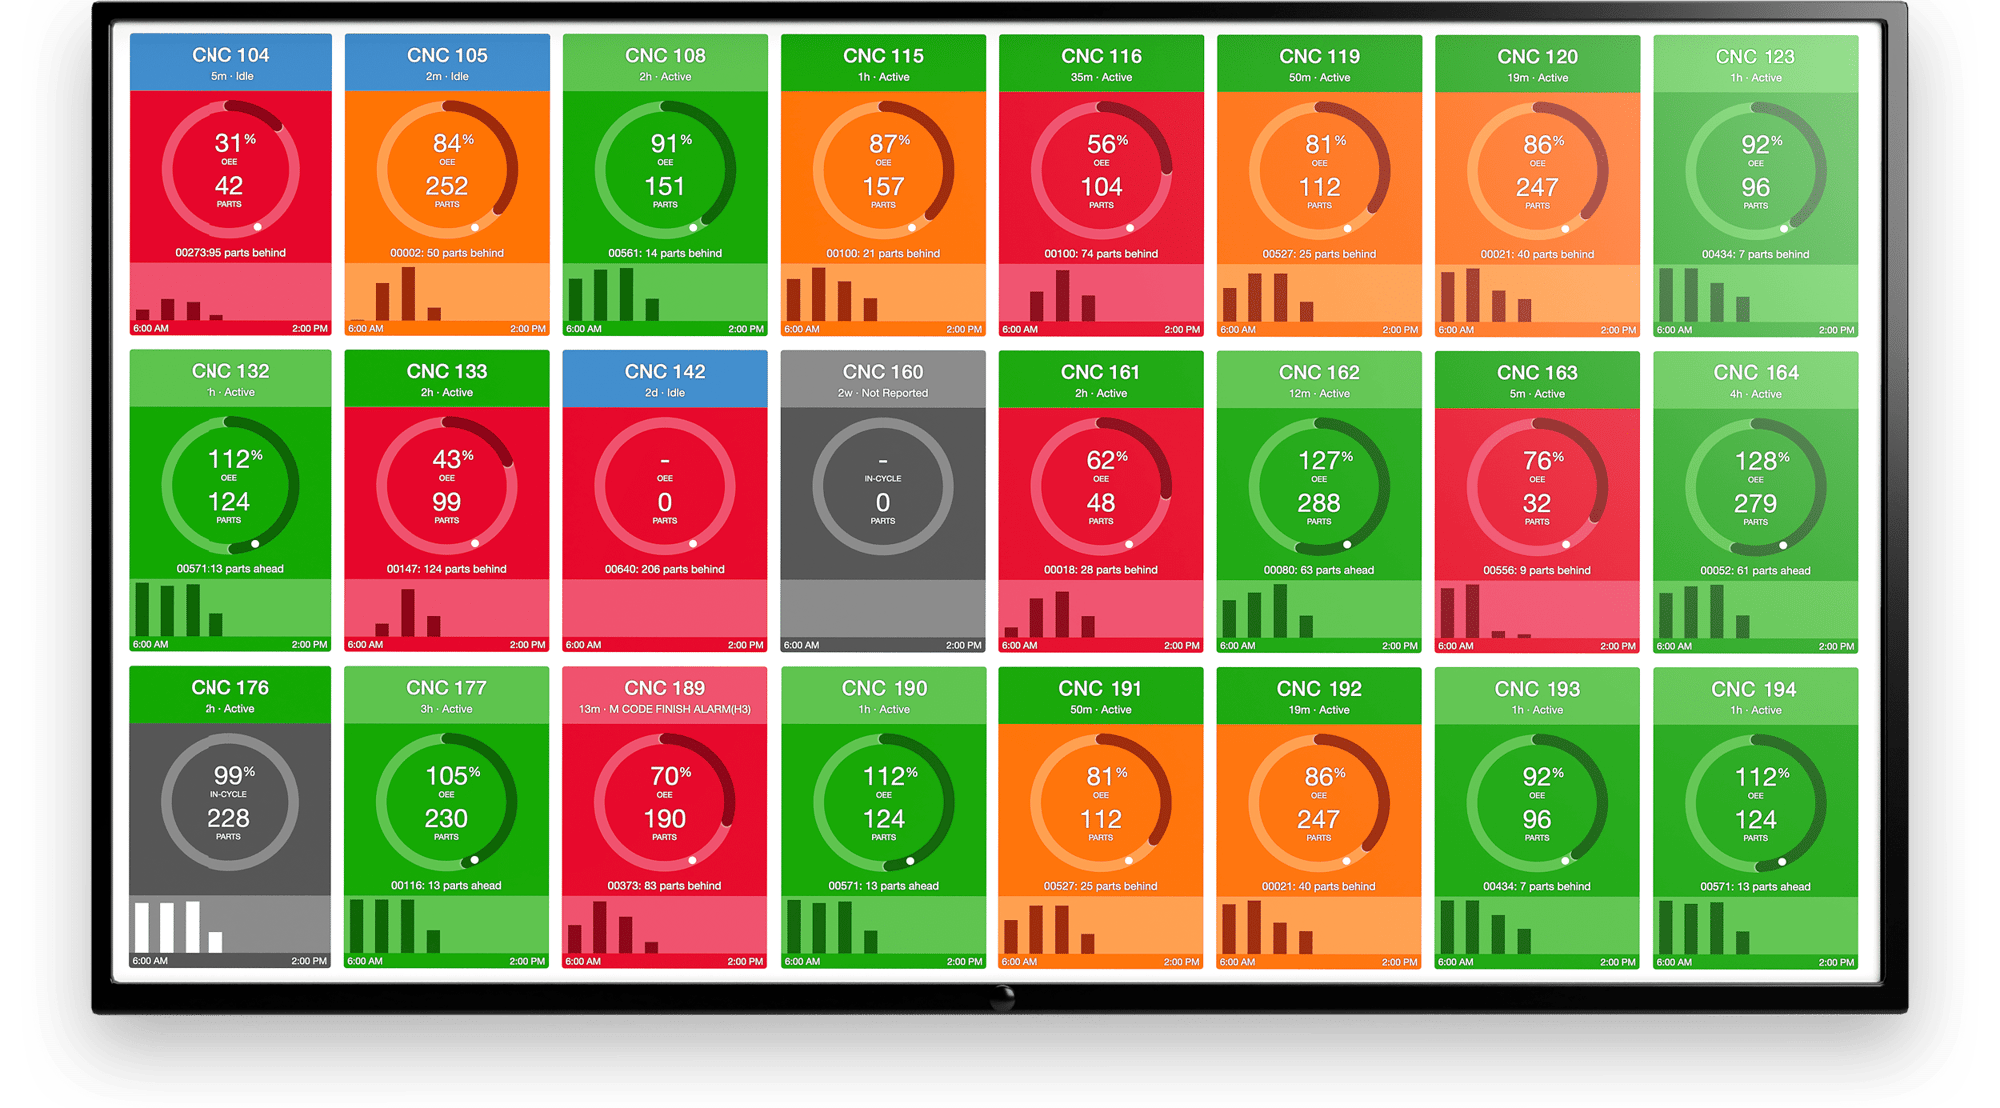
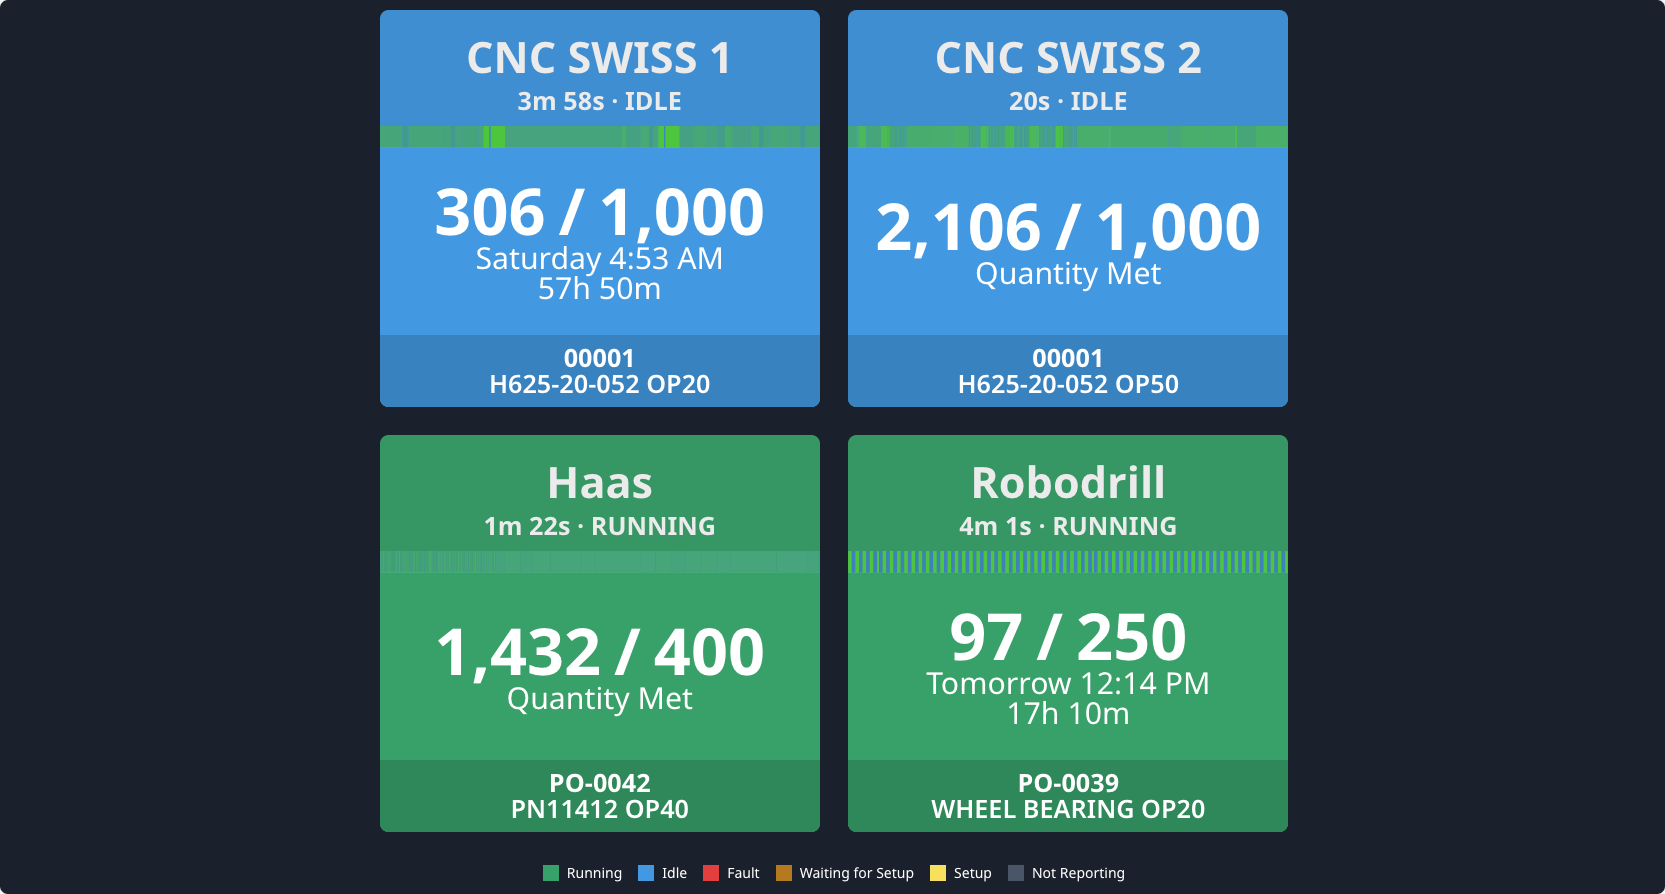
The current shift dashboard is a great solution for monitoring production progress in real-time. It provides visibility of performance to goal so operators can compare expected and actual performance.
There are multiple views that can be used for the current shift dashboard. The most applicable for optimizing job standards will be the Parts Goal view and the OEE view.
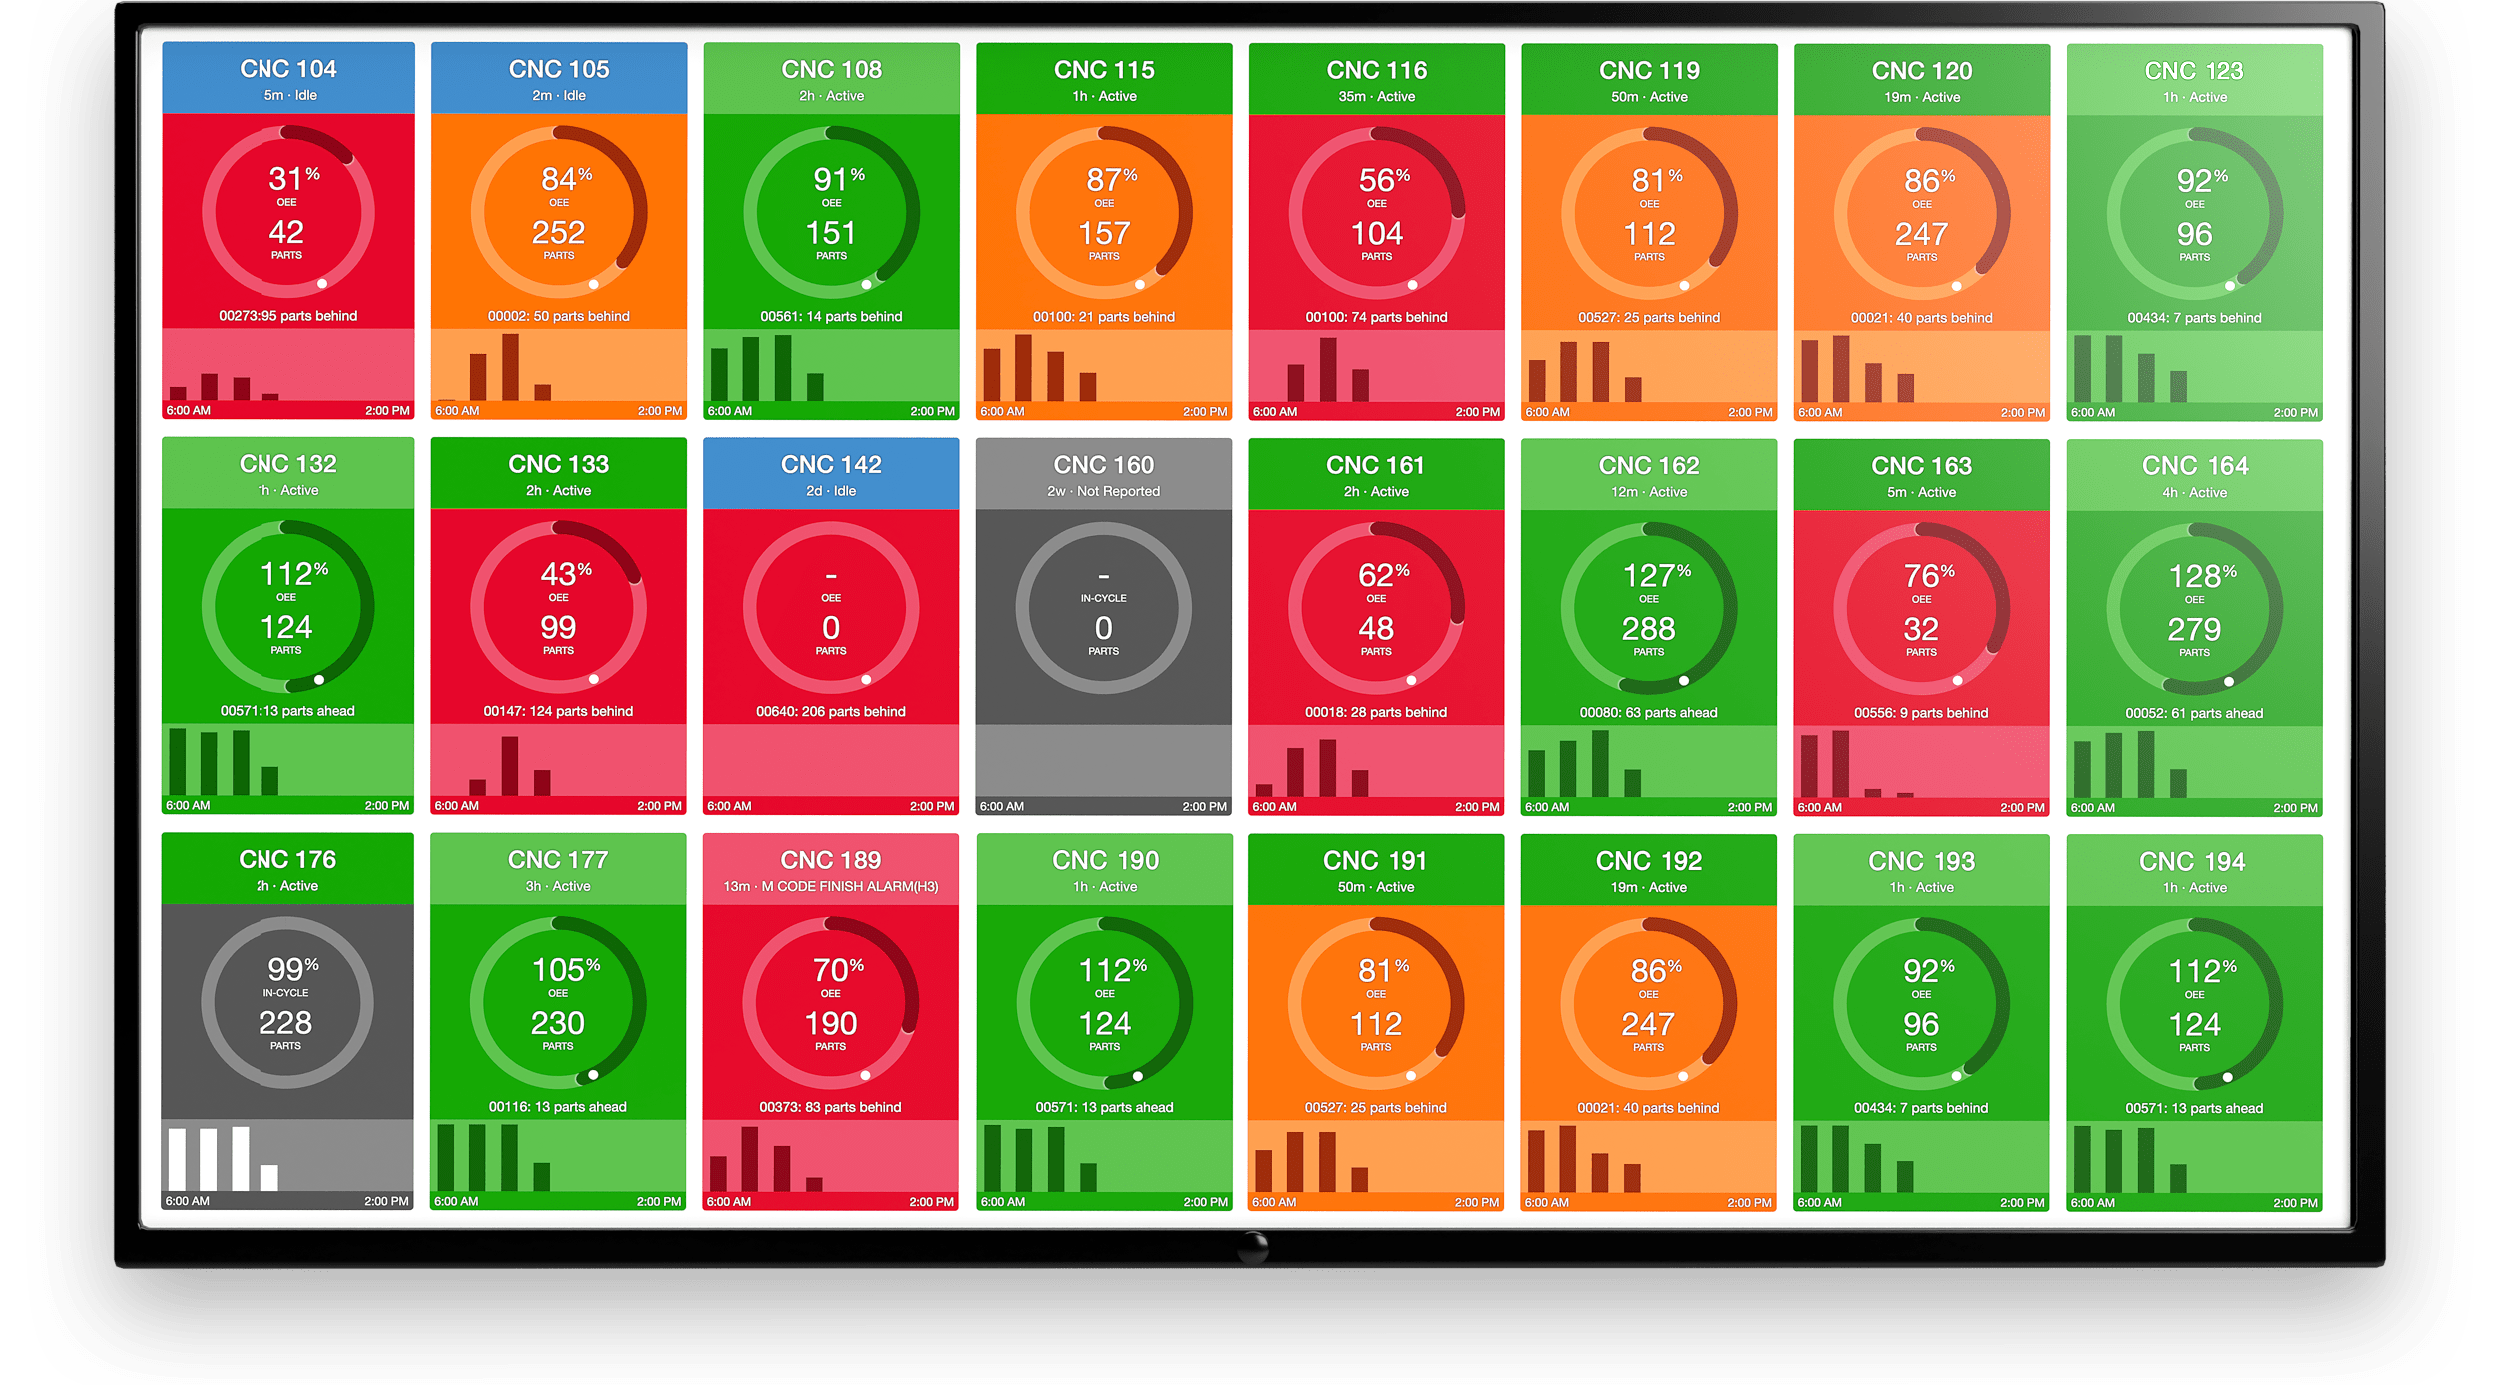
Below is an image of the current shift dashboard on a monitor. Our customers typically mount these monitors throughout the shop floor so that all stakeholders have complete visibility across all applicable machines.
There is also an image of a zoomed-in current shift dashboard that has enabled the "Parts Goal" view.
Automating Job Standard Optimization
When production is monitored with MachineMetrics, it will be evident that some standards are quite far off from the expectation. This is simply a part of the process of updating standards.
Manufacturers should use a job standards workflow to spot suspect standards, determine if they need to be updated, and, if need be, update them in the ERP or other system that manages jobs.
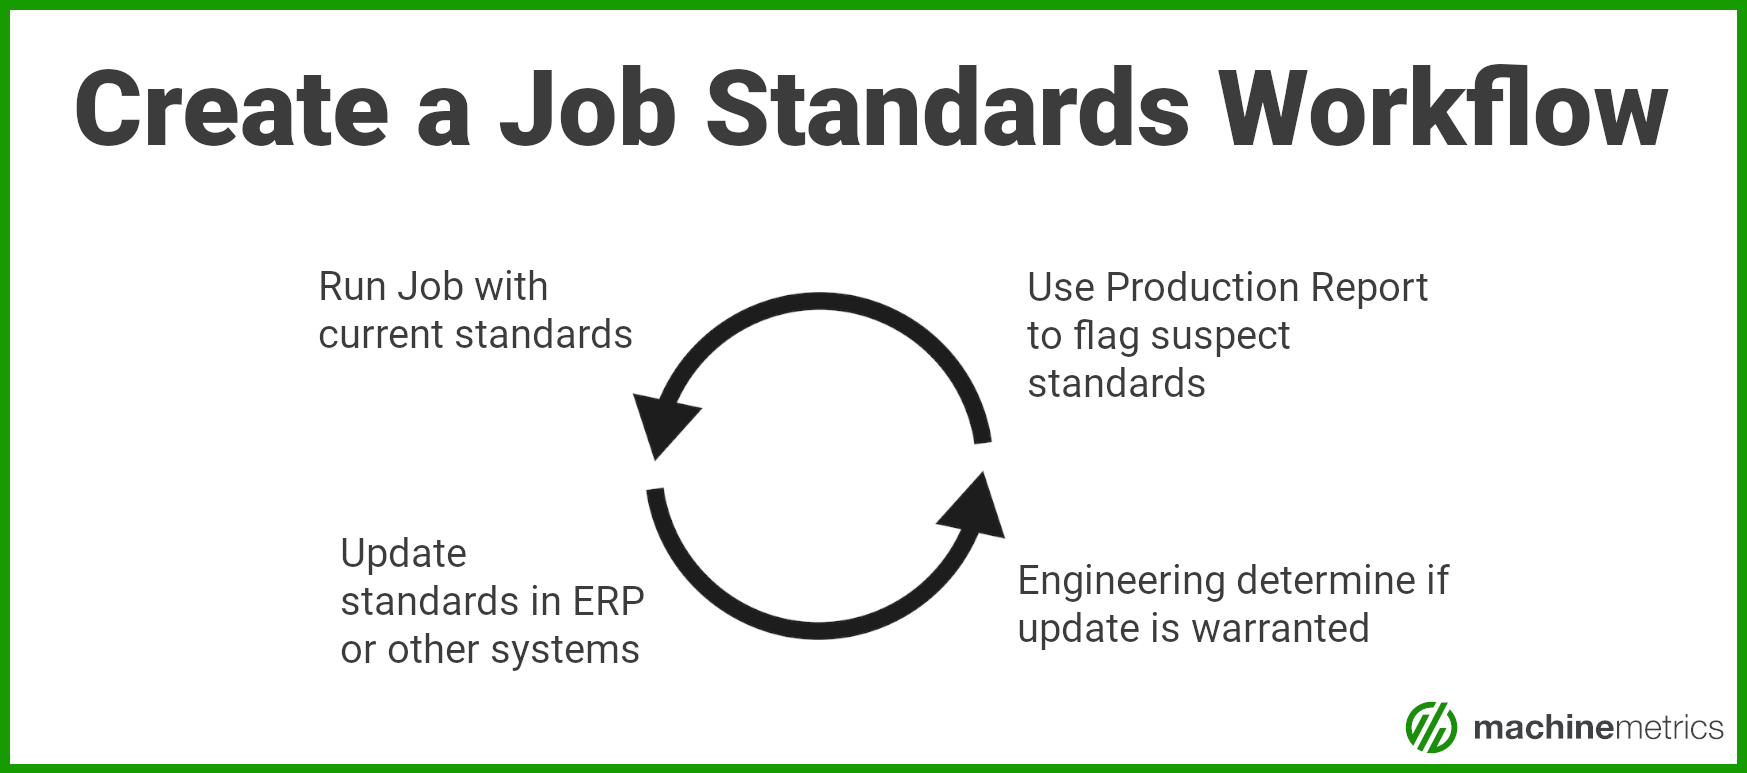
The reason that suspect standards should be evaluated before being updated in your ERP or other management system is that there may be reasonable cause for an actual job to be far off from the expected job.
This is why contextual data provided by operators is incredibly important to understanding overall performance, especially on individual runs where something unlikely could happen that would greatly distort job performance.
For example, let’s say an operator is managing two machines at the same time due to a shortage of staff on a given day. The cycle times for the jobs that the operator is running will likely be higher than expected. Since this is not a common scenario, the cycle time should not be updated.
Automating Data Analysis
Taking this use case further, manufacturers can enable notifications to automate the process of spotting job standard inconsistencies. These notifications can be triggered based on production performance that requires further inspection. For example, let’s say that the cycle time of a job deviates 20% or greater from the expected cycle time. This can automatically alert any stakeholders so they can engage in a deeper analysis and potentially update job standards to reflect the data.
By enabling the notifications, manufacturers can essentially automate the analysis of the data in the production report so that they do not have to manually scan the report to look for cycle times that deviate too far from expected cycle times.
A Demo of MachineMetrics
In the below clip, we walk through how you can use the production report to analyze job runs and identify suspect standards that should be reviewed and potentially updated.
Taking the Next Steps to Accurate Job Standards and Shop Floor Visibility
MachineMetrics unlocks accurate, real-time production data, giving manufacturers the visibility to make better, faster, more confident decisions.
Benchmark and optimize your job standards, identify production bottlenecks, reduce downtime events and scrap parts, and increase your shop's capacity.
If you would like to dive deeper into the subject of job standard optimization, read the full article in our Knowledge Base. If you have any questions for our team, feel free to reach out to us or book a demo.
.png?width=1960&height=1300&name=01_comp_Downtime-%26-Quality_laptop%20(1).png)





Comments