What are Manufacturing KPIs?
Manufacturing KPIs are measurable performance indicators that track important manufacturing metrics such as efficiency, quality, and productivity. KPIs provide visibility into operations, enabling production teams to make data-driven decisions that improve performance, reduce waste, and increase output.
A commonly used manufacturing KPI metric is overall equipment efficiency (OEE), which is measured by calculating the factory’s performance, availability, and quality. While an effective measure of performance, especially at the factory floor, machine-specific level, OEE should ideally be used alongside other KPIs to gain greater clarity on performance from multiple angles to truly allow companies to measure machine efficiency in manufacturing.
Manufacturing businesses can and should choose several KPIs to focus on to help guide decision-making.
Why Are KPIs Important for Manufacturers?
Manufacturing KPIs are essential for any business to ensure smooth manufacturing processes and to achieve continuous improvement. They highlight inefficiency, track progress toward business objectives, and identify changing conditions. With the right KPI manufacturing dashboard in place, you can take advantage of KPIs to unlock instant insights, respond quickly to production challenges, and maintain optimal flow across your operations.
Every level of an organization benefits from manufacturing KPIs. On the factory floor, operators use them to track performance in real-time. Supervisors use them to balance workloads and maintain efficiency, and executives analyze them to align production with company goals and priorities to keep the organization moving forward.
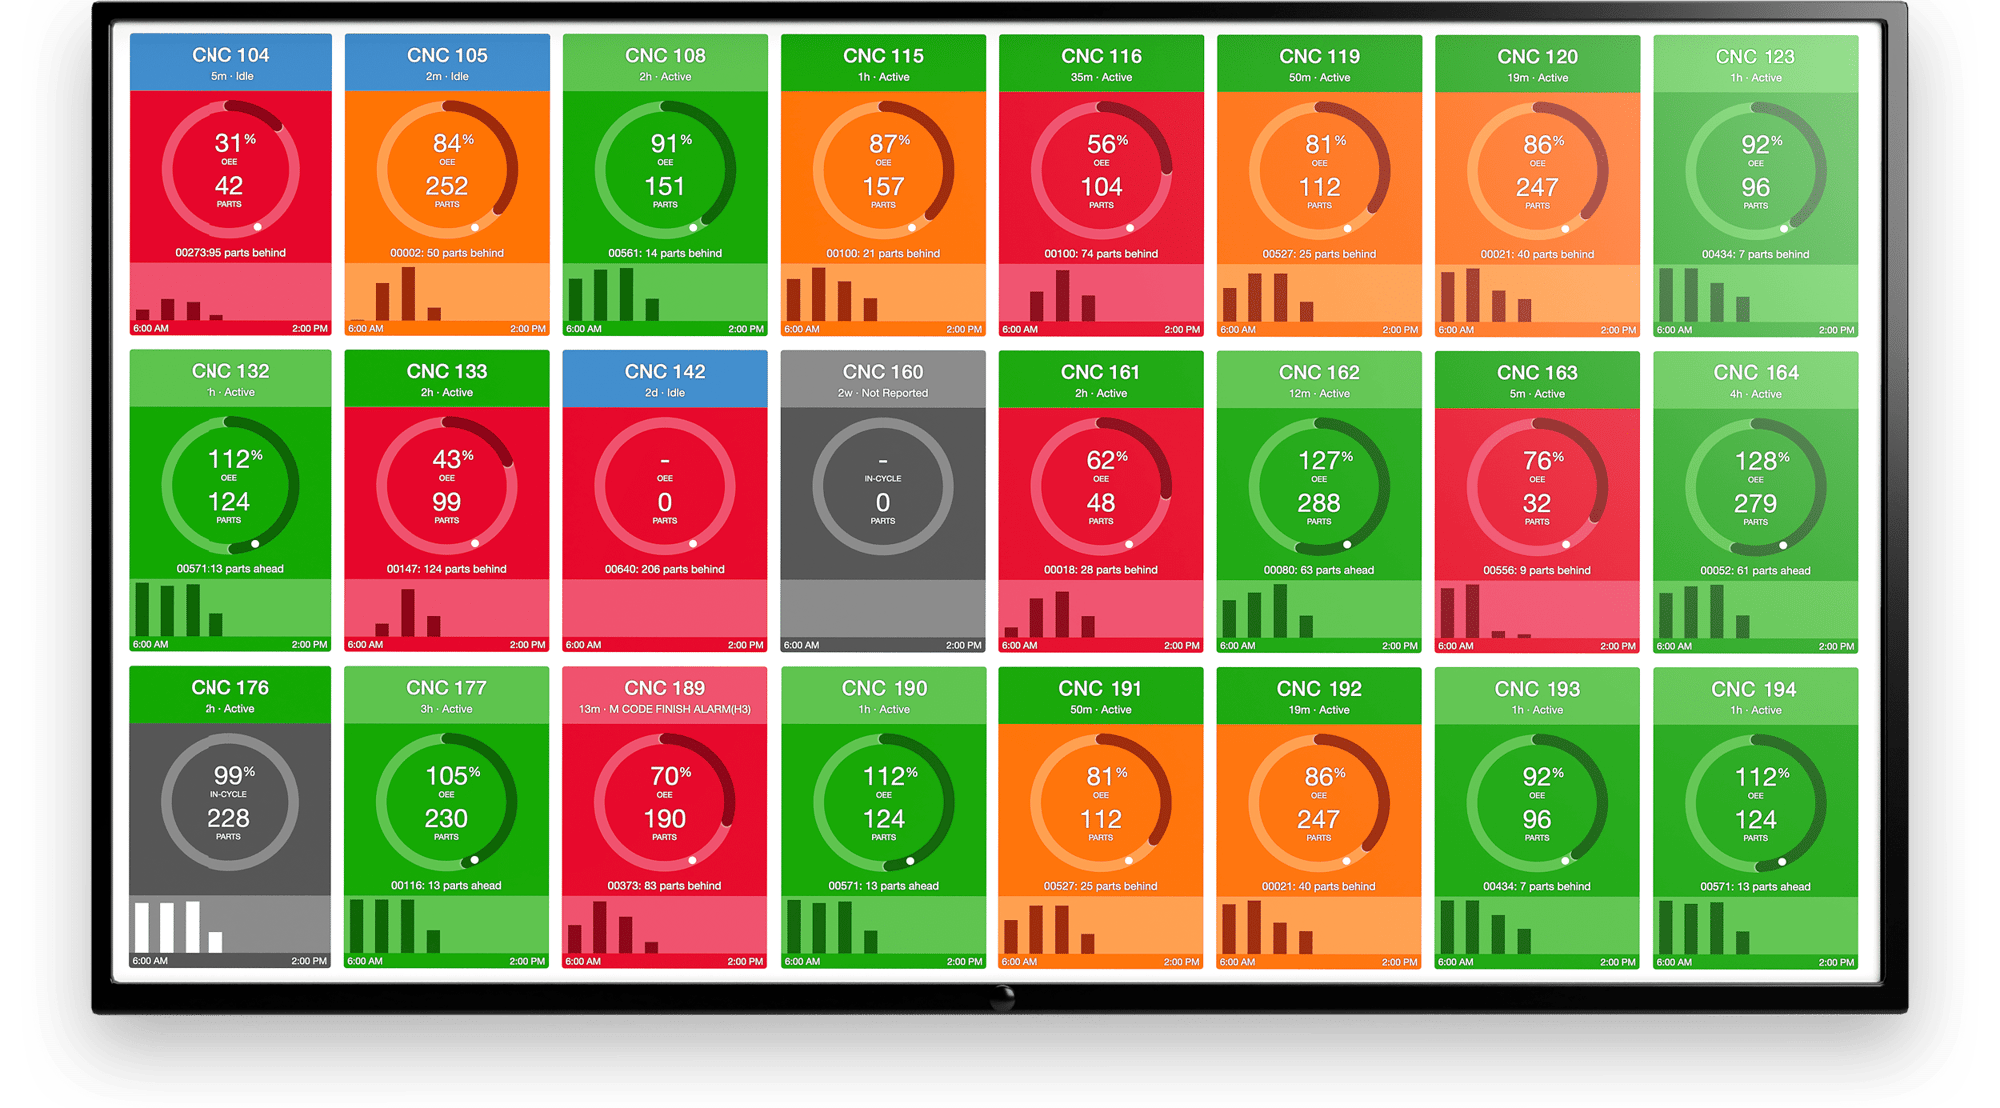
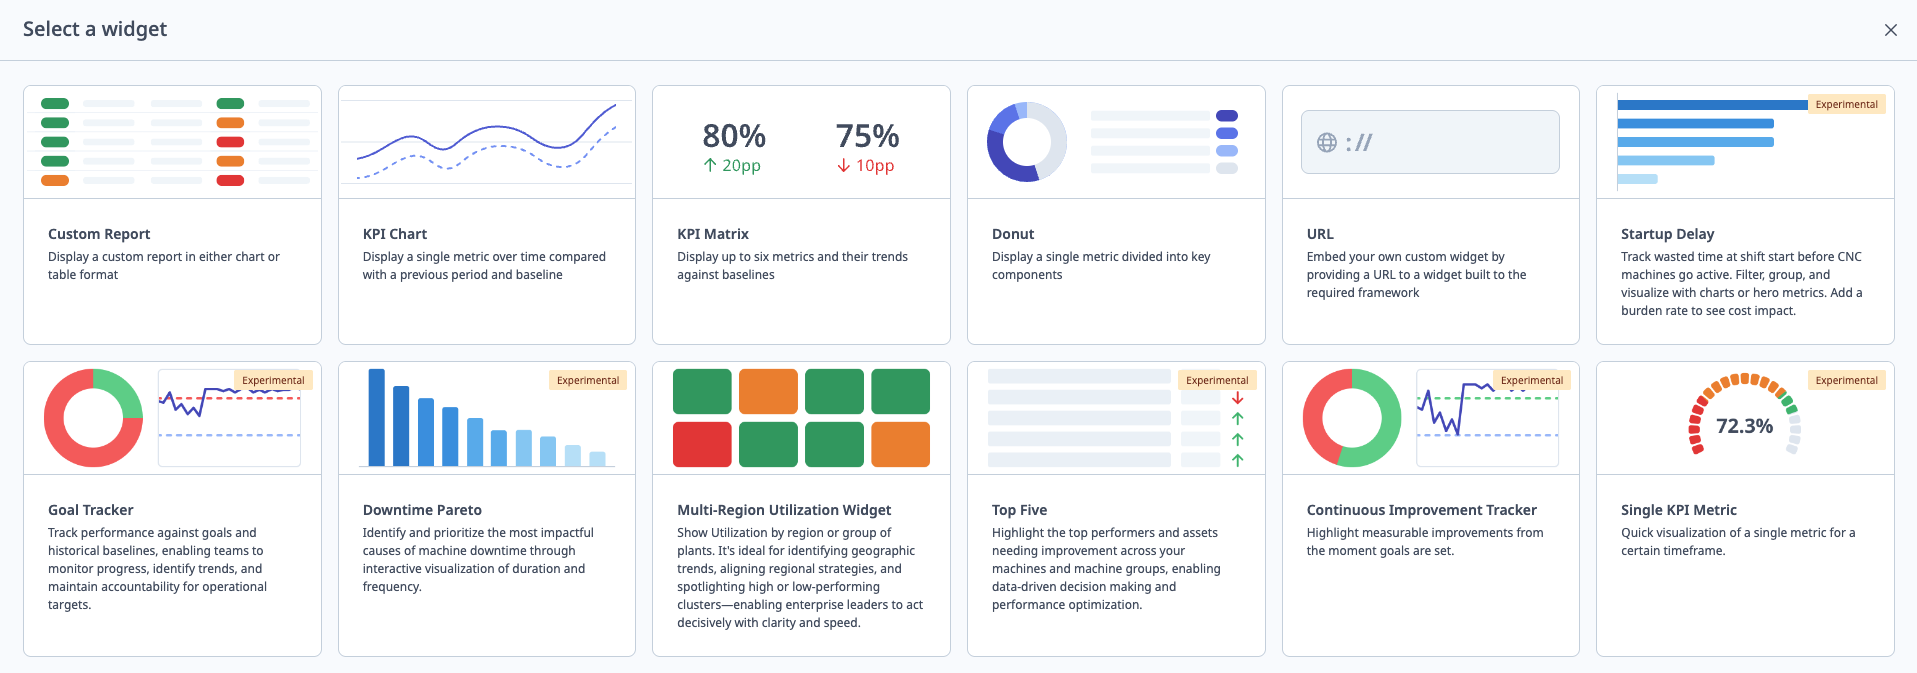
Implementing an advanced manufacturing analytics solution lets manufacturers quickly analyze production KPI data and key manufacturing metrics with a variety of tools that transform machine data into actionable insights. Manufacturing KPI dashboards, data visualizations, and pre-built reports help all stakeholders make fast, effective decisions.
Choosing the Right Manufacturing KPIs for Your Company
The right manufacturing metrics can help you understand performance, process integrity, utilization and machine efficiency in manufacturing.
Some core benefits of the right KPIs include:
-
Gaining insights into production efficiency to enable process improvement and optimization
-
New opportunities to design predictive maintenance strategies
-
Reducing waste, rejects, and other quality concerns
-
Meeting business objectives and goals
While there are dozens of manufacturing KPIs to choose from, there are several that every company should utilize:
Downtime
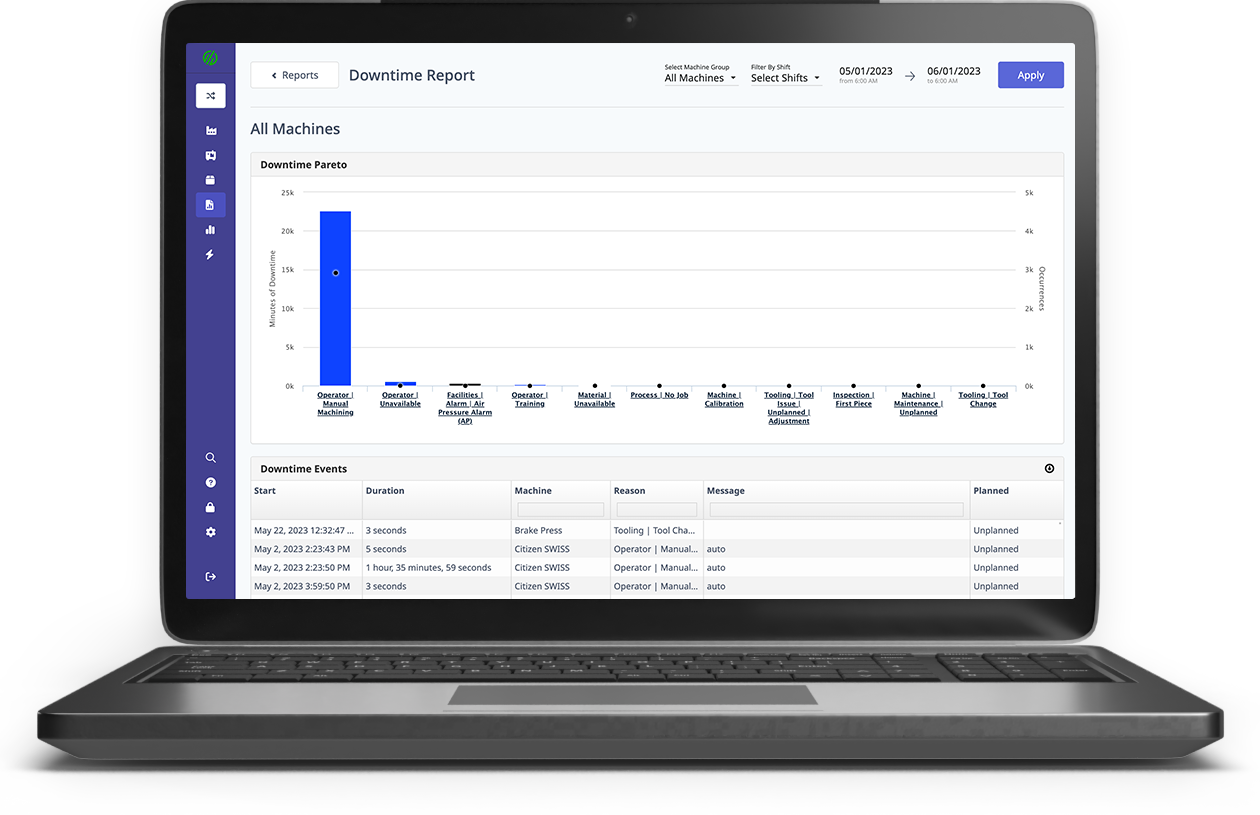
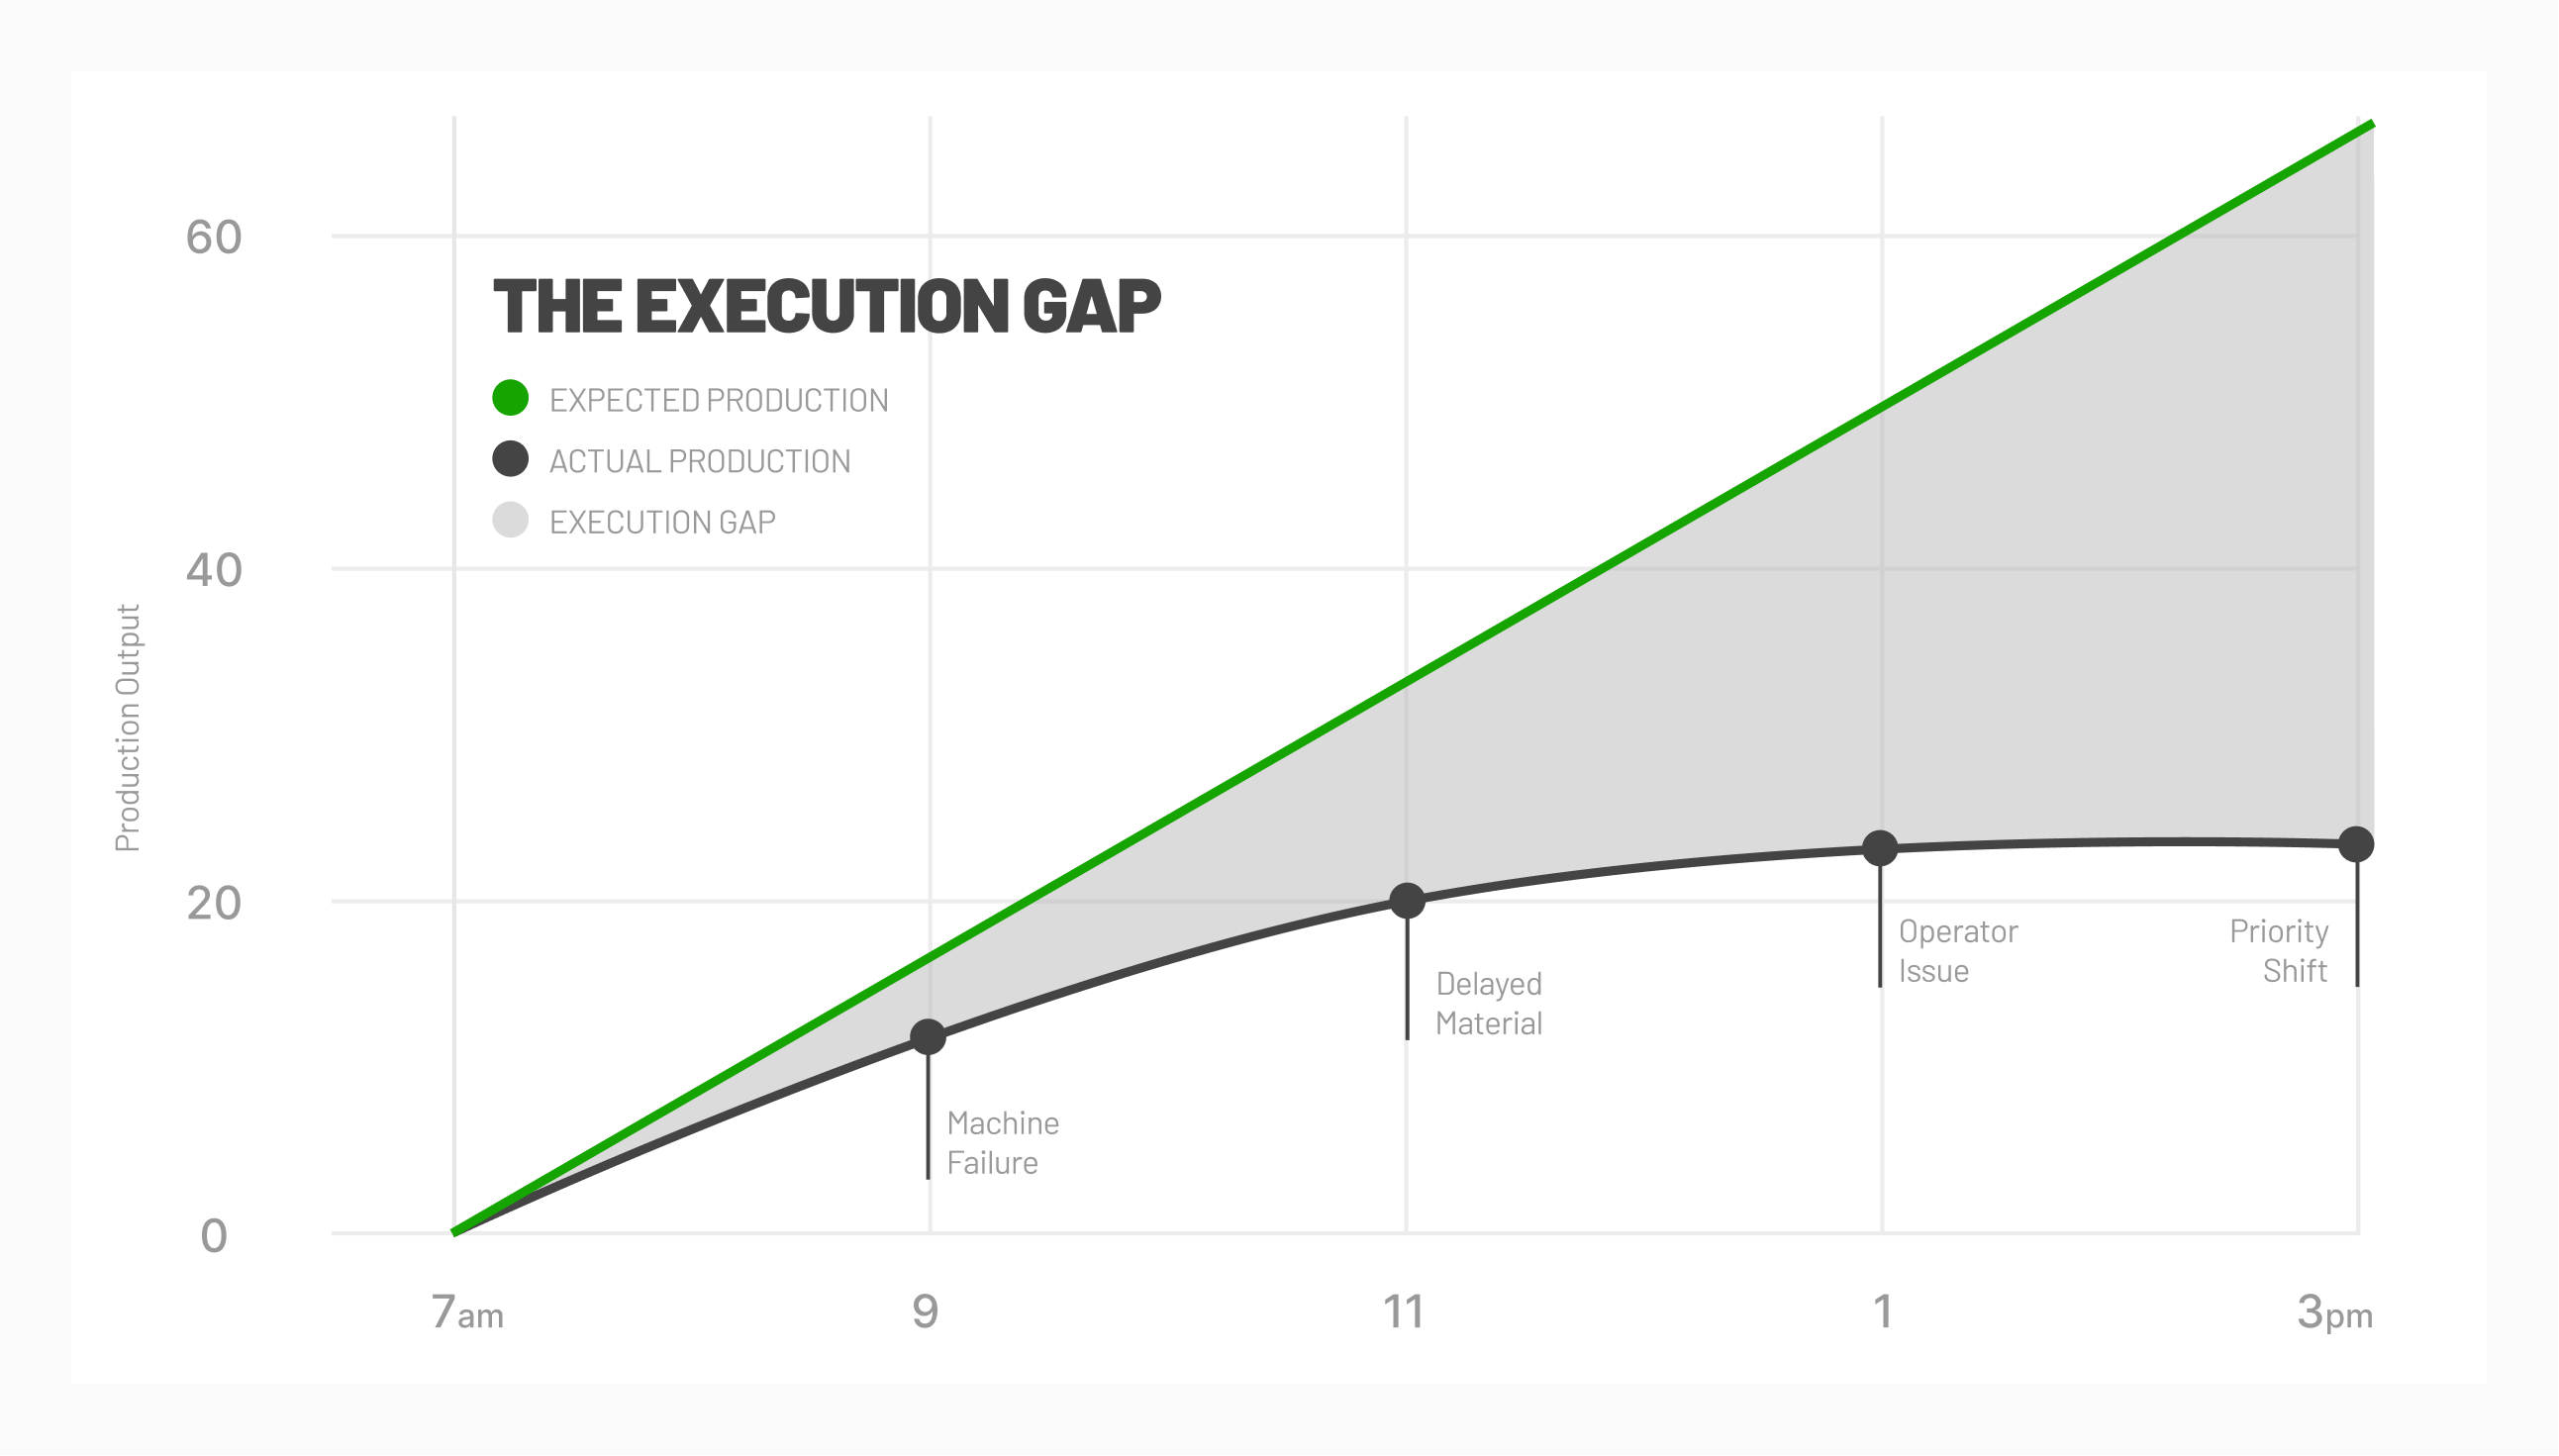
Downtime has long been considered a vital manufacturing metric. It helps identify and address problems impacting production KPI (i.e., efficiency, productivity, maintenance).
Overall Equipment Effectiveness
OEE tells manufacturers how well their machine assets are running. Low OEE indicates problems in one of three areas: machine availability, machine performance, or quality.
Maintenance Metrics
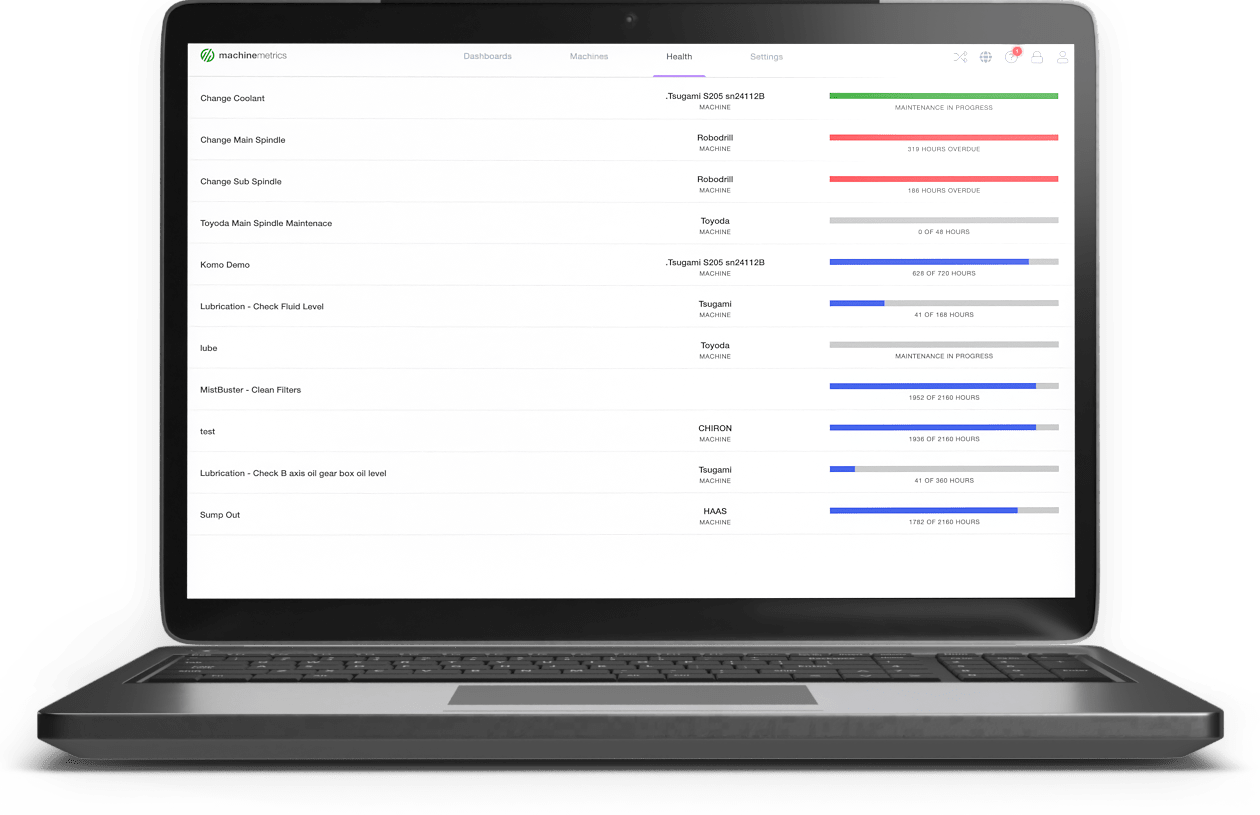
As connected factories become the norm, maintenance strategies shift from preventive to predictive. Advanced analytics can use real-time data collected at the point of production to identify parts that need to be replaced before they become a problem.
Inventory Metrics
Regardless of whether a company runs lean manufacturing or relies on safety stock to buffer against disruption, inventory metrics are vital supply chain KPIs in the manufacturing industry. Inventory turns may point to productivity issues that impact production KPI. When material isn’t moving as expected, it will drive up holding costs and reduce cash flow.
Lead Time
Lead time is another critical factor in measuring performance. It can be tracked by total order process time, production time, delivery time, and more. Each of these times is useful in process optimization and improvement.
Quality KPIs
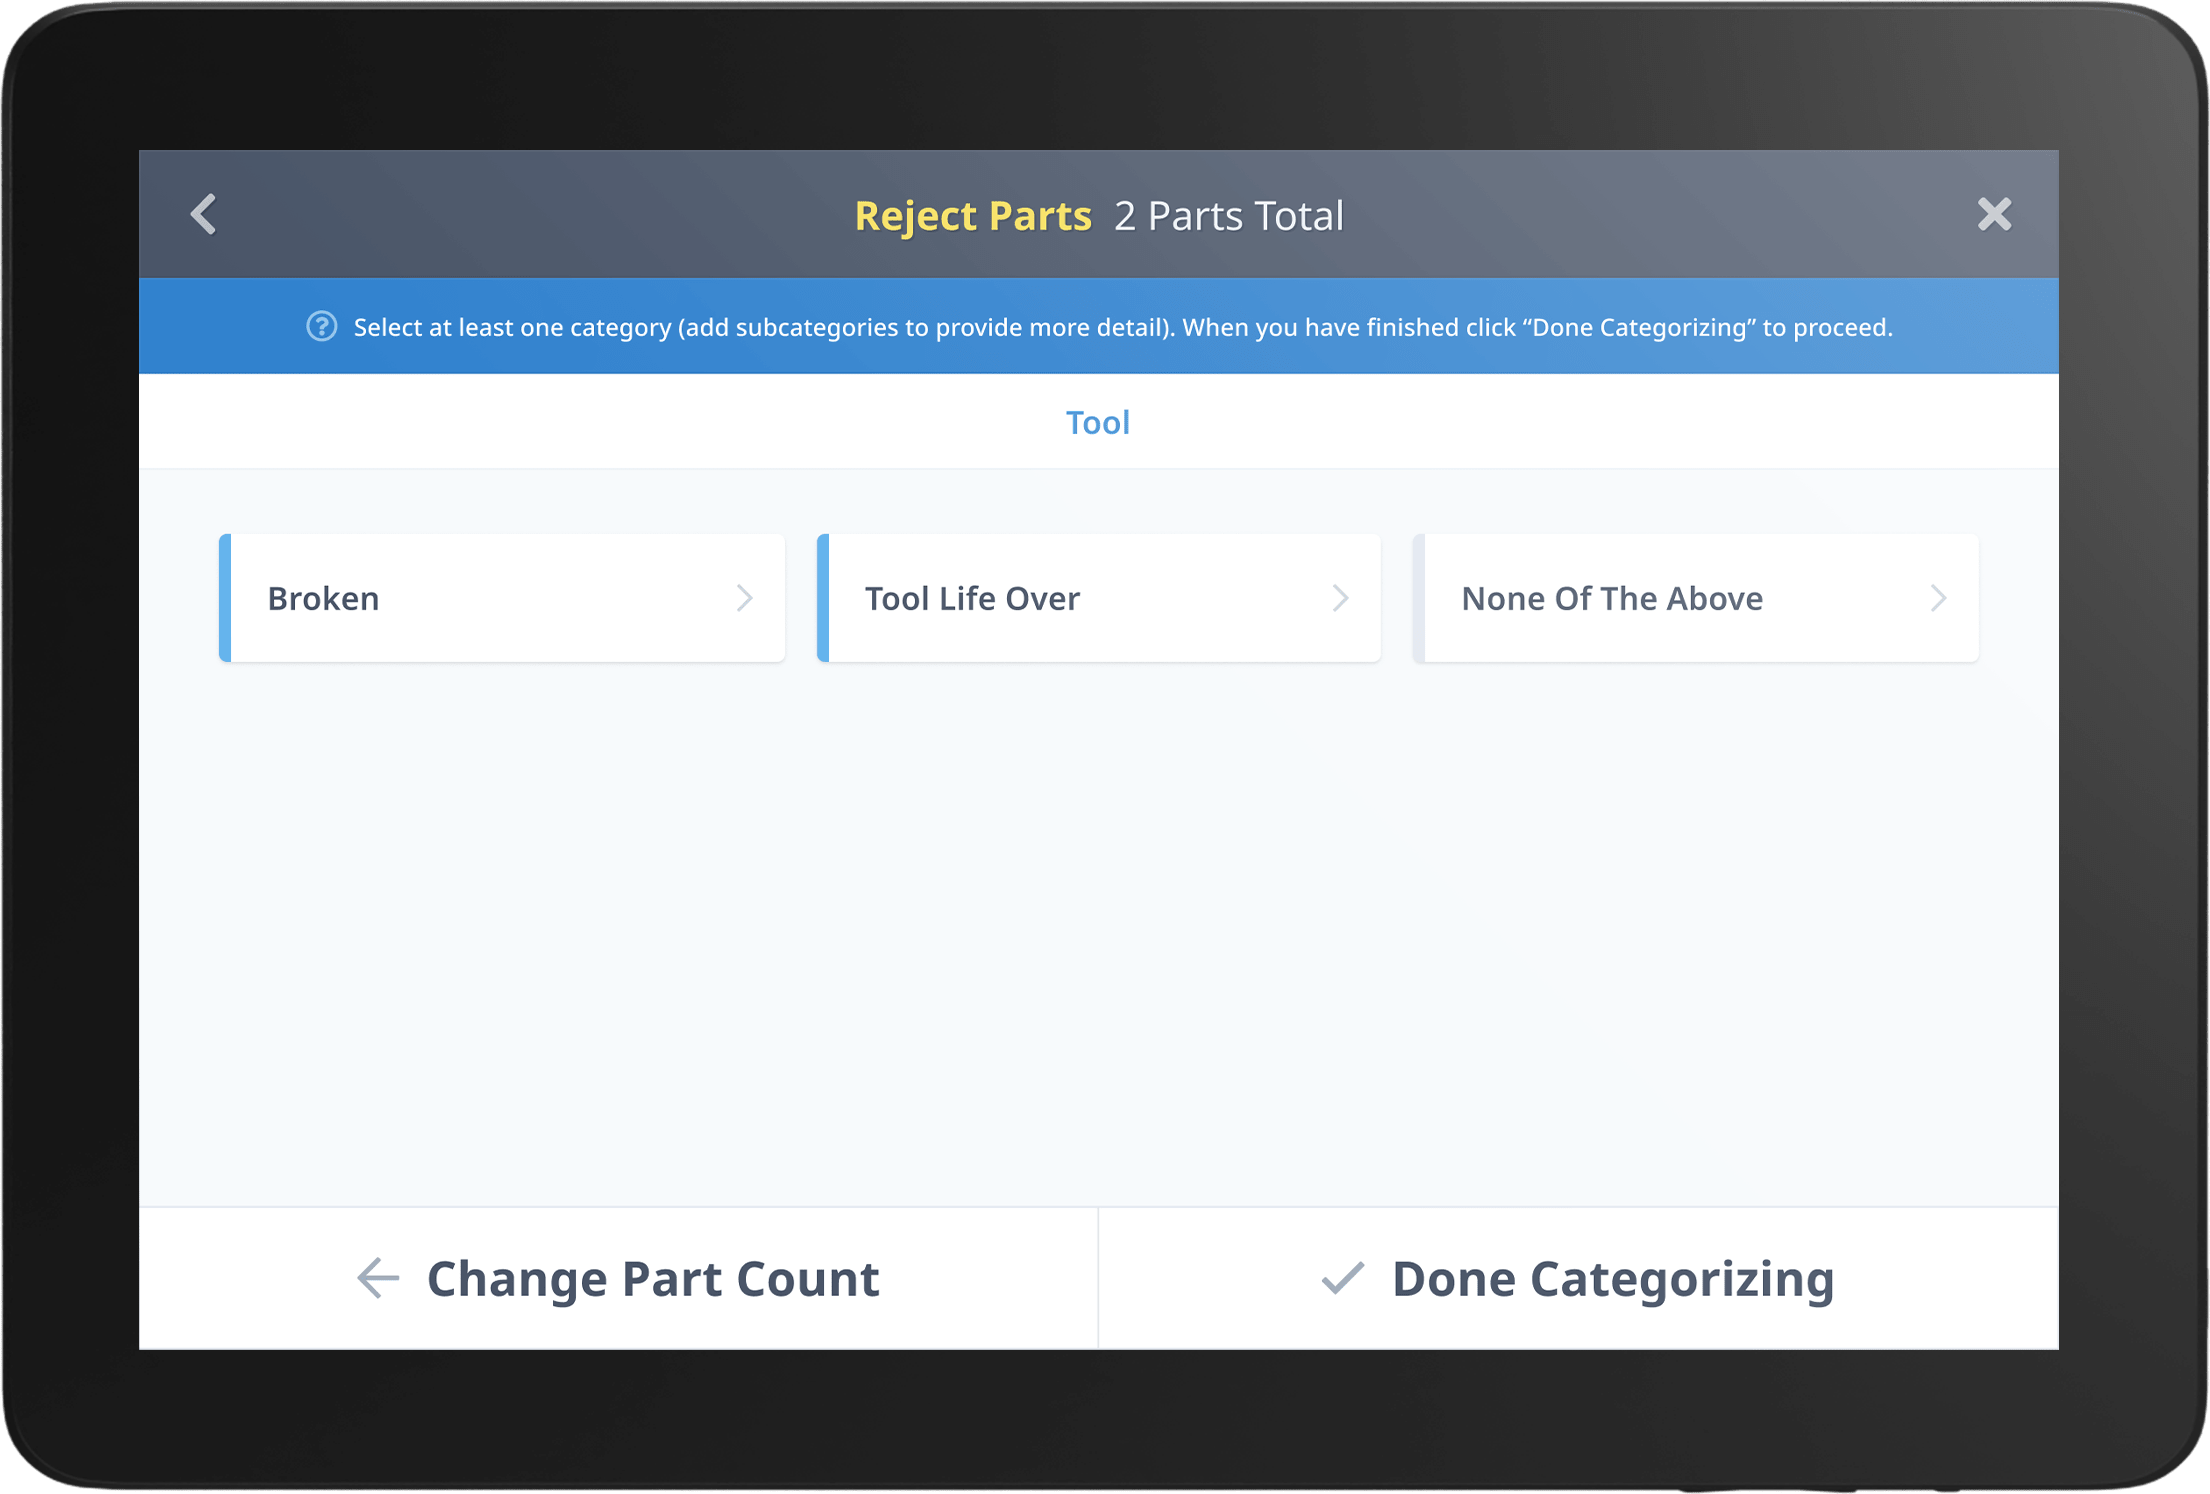
Few things frustrate manufacturers more than rejects. They indicate a problem or a process failure, reduce efficiency, and increase production costs. With a machine data platform, quality KPIs in manufacturing can be tracked and measured at critical points in the production process to catch quality problems as or before they arise. And understanding data-driven quality KPIs in manufacturing can improve operations across the board.
Throughput
Throughput KPIs indicate how each machine performs, helping to identify potential bottlenecks and process improvement opportunities. Throughput KPIs are often tracked alongside other manufacturing performance metrics, like yield, to evaluate performance comprehensively.
How to Track and Use Manufacturing KPIs
Once you’ve decided on the right manufacturing performance metrics, the next step is to track them and put them to use in your operation.
The traditional method for tracking manufacturing KPIs was using manual tracking systems, including the ubiquitous clipboard, standard forms, and manual data entry. They were manually entered into a spreadsheet or, at best, a standalone software system. While using a manual tracking system for manufacturing KPIs is still possible, they’re severely limited in utility.
Manually tracked KPIs are error-prone and subject to bias and omission. They’re also time-lagged; the process takes so long from collection to data entry to analysis that the insights often lack validity and value.
Standalone software is another way to track production and quality KPIs in manufacturing, but it may have limited connectivity to equipment requiring manual data entry. It may not be interoperable with other enterprise software, resulting in time-consuming data exportation and reconciliation before it’s usable across other enterprise resources.
The manual data manipulation and software blend work better than a fully manual system. However, analytical value is limited by these constraints and may be degraded by the time insights are ready for consumption.
The most effective way to track manufacturing KPIs is to use a manufacturing KPI dashboard within a machine data platform like MachineMetrics, which offers full connectivity, advanced analytics, and real-time actionable insights. It eliminates the problems associated with manually tracked manufacturing KPIs and those associated with siloed data within standalone systems that lack interoperability.
Track Your Manufacturing KPIs with MachineMetrics
MachineMetrics’ advanced machine data platform lets you quickly and accurately track manufacturing KPIs. Because the system automatically captures, cleanses, sorts, structures, and standardizes data from all connected assets in real-time, it’s ready for immediate analysis.
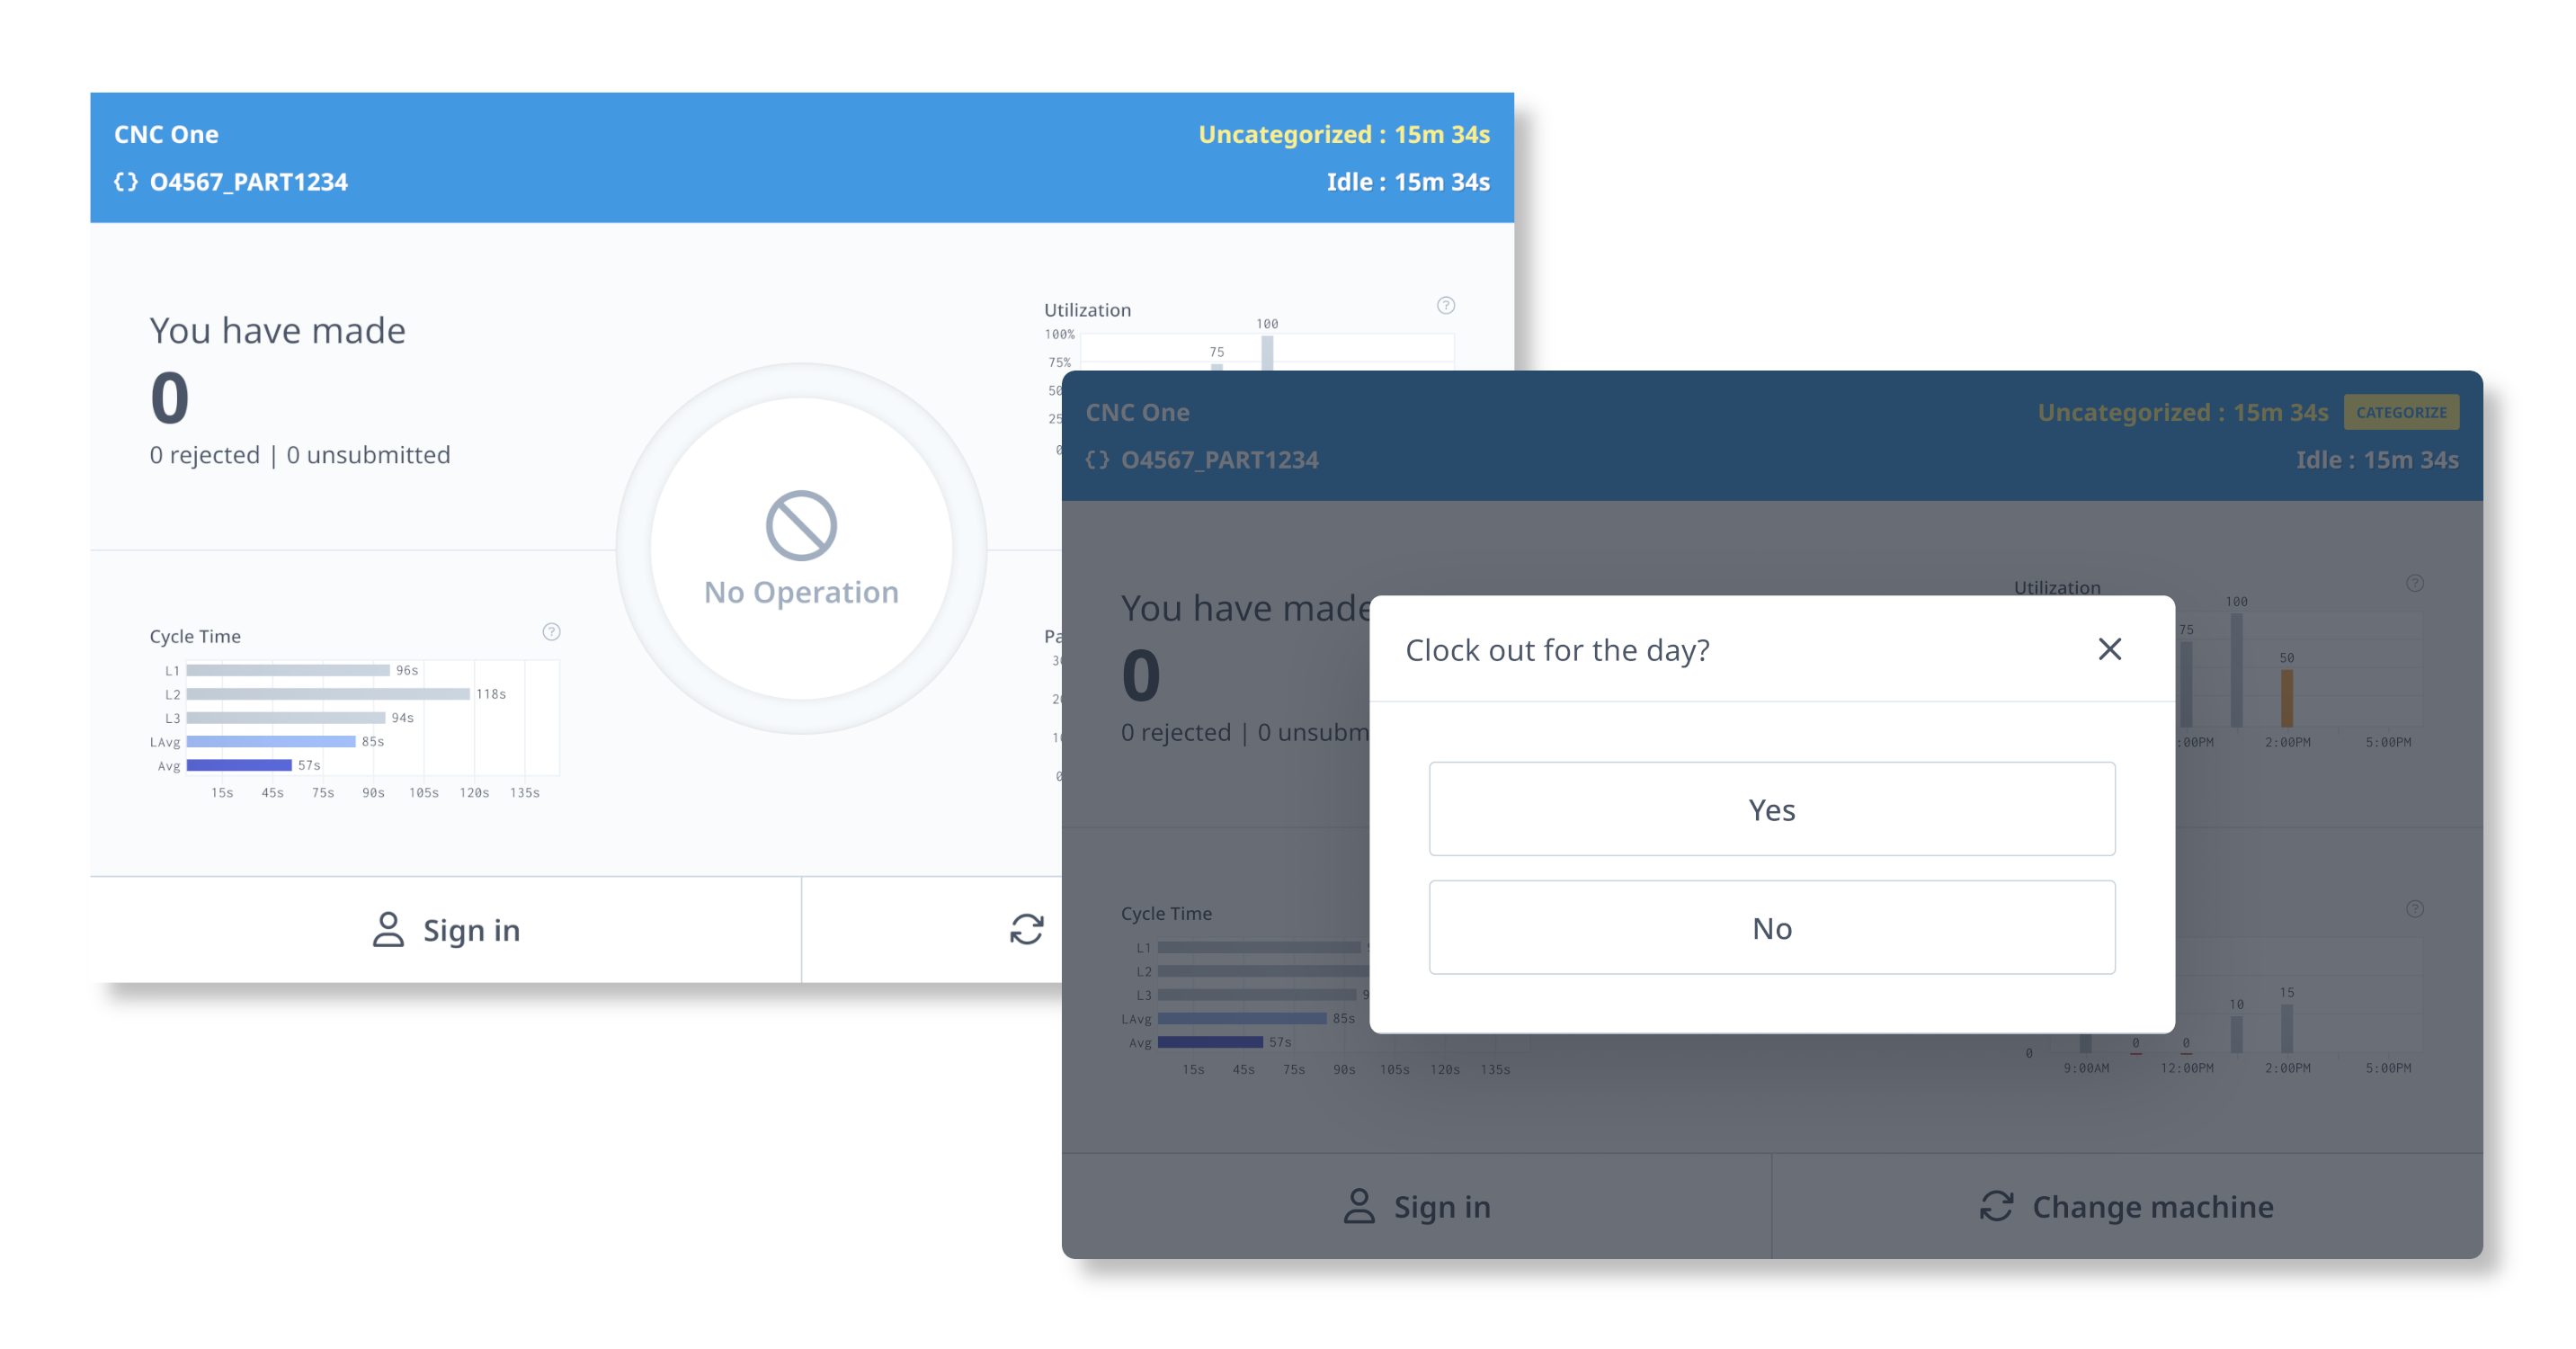
The platform uses out-of-the-box applications that show KPIs across HMIs and dashboards throughout the enterprise. This enables advanced machine monitoring, condition monitoring, and predictive maintenance strategies.
As data is pushed through automated and custom-configured workflows, real-time production KPIs become accessible to users in the format that suits them best. And because the platform integrates with other enterprise software, critical production KPIs can pull in additional data for contextualization or inclusion. This enables the production KPI to represent the most accurate view of production.
The MachineMetrics platform is customizable and can be configured to meet each manufacturer’s specific needs. This flexibility means that KPIs aren’t only accurate and relevant to the reality of the production; they also help improve communication and collaboration because everyone speaks the same language with confidence.
KPIs can also be customized across an intuitive, interactive manufacturing dashboard. Each user can perform their tasks using production KPIs as their guide to trigger action, alerts, calls for assistance, and more. With MachineMetrics, KPIs aren’t just numbers on a screen; they’re visually rich with graphs, Pareto charts, and other visual aids to bring them to life.
Want to See the Platform in Action?
Manufacturing KPIs and Formulas
Below, we cover over 50 KPIs for manufacturing, providing their definitions and how to calculate each of them. Hundreds of manufacturing metrics exist, but we have created a simple way to browse through the most important production KPIs. You can skip any manufacturing metric by selecting it in the table below.
You can also jump directly to the "Manufacturing KPI Dashboards, Reports, and Templates" section. KPI dashboards are essential for visibility on various levels of the organization, including shop managers, operators on the shop floor, and corporate. Within that section, we show off some of the simple, helpful production KPI dashboards available from MachineMetrics.
Asset Turnover
What is Asset Turnover?
Asset Turnover is the value of sales or revenues generated. It measures the efficiency with which a manufacturer uses its equipment and other assets to drive revenue. Companies with a high turnover ratio are more efficient than those with a lower turnover.
How to Calculate Asset Turnover
Asset Turnover = Net Sales / Average Total Assets
Asset Utilization
What is Asset Utilization?
Asset Utilization is the total revenue earned for every dollar of assets owned. It is among the best quantifiable measures of how well you are using your installed capacity.
How to Calculate Asset Utilization
Asset Utilization = (Actual Output / Maximum Capacity) *100
Availability
What is Availability?
Availability is the run time compared to planned production time. It is similar to overall availability but uses planned production time rather than total calendar time. Learn more about calculating and improving availability.
How to Calculate Availability
Availability = Uptime / (Uptime + Downtime)
Avoided Cost
What is Avoided Cost?
Avoided Costs are expenses the manufacturers will not incur if the associated activity is no longer done. For example, a manufacturer may discontinue a product line, which means they will have various avoided costs in the form of labor and equipment usage.
How to Calculate Avoided Cost
Avoided Cost = Sum of expenses avoided from foregoing a particular activity
Capacity Utilization
What is Capacity Utilization?
Capacity Utilization is the rate at which potential output levels are being met or used. It essentially tracks how much of a manufacturer’s production capacity is currently being utilized.
How to Calculate Capacity Utilization
Capacity Utilization = (Actual output/Maximum possible output)*100
Cash To Cash Cycle Time
What is Cash To Cash Cycle Time?
Also known as the cash-conversion cycle, Cash To Cash Cycle Time is the number of days between paying for raw materials and components and getting paid for a product.
How to Calculate Cash To Cash Cycle Time
Cash To Cash Cycle Time = (Days Inventory Outstanding) + (Days Sales Outstanding) - (Days Payables Outstanding)
Changeover Time
What is Changeover Time?
Changeover Time is the time elapsed from the last good part of the previous run to the first good part of the following run.
How to Calculate Changeover Time
Changeover Time = T∆ = total changeover time, typically in minutes or seconds
T∆e = external changeover time, in the same unit of measure as T∆
T∆i = internal changeover time, in the same unit of measure as T∆"
Customer Return Rate
What is Customer Return Rate?
Customer Return Rate is the percentage of customers returning to place another order. It is essential for retaining business and building customer loyalty.
How to Calculate Customer Return Rate
Customer Return Rate = (return customers / total customers) * 100
Cycle Time
What is Cycle Time?
Cycle Time is how long it takes to make a part or how long it takes the machine to complete a cycle.
How to Calculate Cycle Time
Cycle Time = total parts produced / production run time
Demand Forecasting
What is Demand Forecasting?
Demand Forecasting works to predict customer demand to optimize supply choices.
How to Calculate Demand Forecasting
There are a variety of variables to consider when calculating future demand, including historical sales, forecasts from suppliers, seasonal and economic changes, and unique business challenges and constraints. Here is a good resource on demand forecasting for manufacturers.
Direct Material Usage Variance
What is Direct Material Usage Variance?
Direct Material Usage Variance is the difference between the standard quantity of materials that should have been used for the number of units actually produced and the actual quantity of materials used, valued at the standard cost per unit of material
How to Calculate Direct Material Usage Variance
Direct Material Usage Variance = (standard quantity of material allowed for production – actual quantity used) × standard price per material unit. (standard quantity of material allowed for production – actual quantity used) × standard price per unit of material
Employee Turnover
What is Employee Turnover?
Employee Turnover is the number or percentage of workers who leave an organization and are replaced by new employees.
How to Calculate Employee Turnover
Employee Turnover = (Total number of leavers in a month / average number of employees in a month ) * 100
Energy Cost Per Unit
What is Energy Cost Per Unit?
Energy Cost Per Unit is a measure of the cost of energy (electricity, steam, oil, gas, etc.) required to produce a specific unit or volume of production.
How to Calculate Energy Cost Per Unit
Energy Cost Per Unit = Sum of all energy costs / Units or Volume of Production
First Pass Yield
What is First Pass Yield?
Also known as throughput yield, First Pass Yield is defined as the number of good units (that do not require rework) coming out of a process divided by the number of units going into that process over a specified period of time.
How to Calculate First Pass Yield
First Pass Yield = number of “good” units completed (excluding scrap/rework) / total number of units entering the process
Health And Safety Incident Rate (Total Case Incident Rate (TCIR)
What is Health And Safety Incident Rate?
Health and Safety Incident Rate, also known as the total case incident rate (TCIR), is the number of work-related injuries per 100 full-time workers during a one-year period
How to Calculate Health And Safety Incident Rate (Total Case Incident Rate (TCIR)
Health And Safety Incident Rate = (Number of OSHA Recordable injuries and illnesses X 200,000) / Employee total hours worked = Total Case Incident Rate. (Provided by OSHA)
Inventory Accuracy
What is Inventory Accuracy?
Inventory Accuracy measures the discrepancies that exist between electronic records that represent the inventory and the physical state of the inventory.
How to Calculate Inventory Accuracy
Inventory Accuracy = number of counted items that perfectly match every aspect of the record / total number of items counted
Inventory Carrying Costs
What are Inventory Carrying Costs?
Inventory Carrying Costs are the total of all expenses related to storing unsold goods.
How to Calculate Inventory Carrying Costs
Inventory Carrying Cost = inventory holding sum / total value of inventory, then multiplied by 100
Inventory Turns
What is Inventory Turns?
Inventory Turns is the ratio that measures the number of times inventory is sold or consumed in a given time period .
How to Calculate Inventory Turns
Inventory Turns = cost of goods sold (COGS) / average inventory during the same period
Labor As A Percentage Of Cost
What is Labor As A Percentage Of Cost?
Labor As A Percentage Of Cost is the percentage value of money spent on labor costs against the total revenue of the company during a specific period.
How to Calculate Labor As A Percentage Of Cost
Labor As A Percentage Of Cost = Labor Costs / Gross Sales
Machine Downtime Rate
What is Machine Downtime Rate?
Machine Downtime Rate is any time the equipment is not available for production, including planned and unplanned downtime. Downtime is considered the largest source of lost production time for manufacturing, which makes this an incredibly important metric.
How to Calculate Machine Downtime Rate
Machine Downtime Rate = (total uptime) / (total uptime + total downtime)
Machine Set Up Time
What is Machine Set Up Time?
Machine Set Up Time is the period of time that is required to prepare a machine for its next run after it has completed production of the last part of the previous run.
How to Calculate Machine Set Up Time
Machine Set Up Time = Time machine is prepared for next run - time completed last part of previous run
Maintenance Cost Per Unit
What is Maintenance Cost Per Unit?
Maintenance Cost Per Unit is the total maintenance cost divided by the number of produced units in a given period of time.
How to Calculate Maintenance Cost Per Unit
Maintenance Cost Per Unit = total maintenance cost / number of produced units in measurement period
Manufacturing Cost As A Percentage Of Revenue
What is Manufacturing Cost As A Percentage Of Revenue?
Manufacturing Cost As A Percentage Of Revenue is the ratio of total manufacturing costs to the overall revenue produced by the manufacturing plant or business unit.
How to Calculate Manufacturing Cost As A Percentage Of Revenue
Manufacturing Cost As A Percentage Of Revenue = total manufacturing costs / overall revenue
Manufacturing Cost Per Unit
What is Manufacturing Cost Per Unit?
Manufacturing Cost Per Unit is the breakdown of all the fixed and variable costs that are encountered in the process of producing a single product
How to Calculate Manufacturing Cost Per Unit
Manufacturing Cost Per Unit = manufacturing costs / total number of units produced during a given period
Manufacturing Lead Time
What is Manufacturing Lead Time?
Manufacturing Lead Time is the time period between the placement of a customer order and the shipment of the completed order to the customer.
How to Calculate Manufacturing Lead Time
Manufacturing Lead Time = order delivery date - order received date
Material Yield Variance
What is Material Yield Variance?
Material Yield Variance is the difference between the actual amount of material used and the standard amount expected to be used, multiplied by the standard cost of the materials.
How to Calculate Material Yield Variance
Material Yield Variance = (Actual unit usage - Standard unit usage) x Standard cost per unit
Mean Time Between Failure (MTBF)
What is Mean Time Between Failure?
Mean Time Between Failure is the predicted elapsed time between inherent failures of a mechanical or electronic system, during normal system operation.
How to Calculate Mean Time Between Failure
Mean Time Between Failure = number of operational hours / number of failures
Mean Time To Repair (MTTR)
What is Mean Time To Repair?
Mean Time To Repair is the basic measure of the maintainability of repairable items. It is essentially the average time it takes to repair either failed equipment or a failed part. It is most commonly represented in hours.
How to Calculate Mean Time To Repair
Mean Time To Repair = sum of unplanned maintenance time spent on repair / total number of failures
Non-compliance Events Per Year
What is Non-compliance Events Per Year?
Non-compliance Events Per Year is a measure of the number of times a plant or facility operated outside the guidelines of normal regulatory compliance rules during a one-year period
How to Calculate Non-compliance Events Per Year
Simply the number of non-compliance events within a given year.
On-time Delivery
What is On-time Delivery?
On-time Delivery is the ratio of finished goods or shipments delivered on time to customers as a percentage of total units delivered or shipped. It is a good metric to use in ensuring customer satisfaction.
How to Calculate On-time Delivery
On-time Delivery = on time units / total units
Overall Equipment Effectiveness (OEE)
What is Overall Equipment Effectiveness?
Overall Equipment Effectiveness provides a means to measure the percentage of planned manufacturing time that is productive. OEE is calculated by multiplying availability, performance and quality and is represented by a percentage and only considers scheduled time. An OEE of 100% would mean that a manufacturer producing only good parts, as fast as possible, with no stop time.
How to Calculate Overall Equipment Effectiveness
Overall Equipment Effectiveness = Availability x Performance x Quality
Where:
- Availability = actual production time / planned production time
- Performance = actual production rate / ideal production rate
- Quality = good parts / total parts produced
Overall Operating Efficiency (OOE)
What is Overall Operating Efficiency?
Overall Operating Efficiency is similar to OEE except it takes unscheduled time into account, looking at Total Operations Time as the maximum.
How to Calculate Overall Operating Efficiency (OOE)
Overall Operating Efficiency (OOE) = Availability (where Availability = Actual Production Time / Operating Time) x Performance x Quality
Percentage Maintenance Planned (PMP)
What is Percentage Maintenance Planned?
Percentage Planned Maintenance is the a maintenance metric that measures the number of planned maintenance tasks in comparison to all maintenance tasks.
How to Calculate Percentage Maintenance Planned
Percentage Planned Maintenance = # of planned maintenance hours ÷ # of total maintenance hours × 100
Plant Downtime
What is Plant Downtime?
Plant Downtime, also known as idle time, off line period or production downtime, is any time in which a manufacturing plant is off-line and not producing any products or adding value to the business and its customers.
How to Calculate Plant Downtime
Plant Downtime is simply the sum of all downtime for a plant within a given period.
Production Attainment
What is Production Attainment?
Production Attainment is the number of units manufactured by the company divided by target production output over a certain period of time, as a percentage. It measures the extent to which a manufacturer reaches its targeted production output.
How to Calculate Production Attainment
Production Attainment = total number of units manufactured by the company / target production output over a certain period of time
Production-to-Market Lead-time
What is Production-to-Market Lead-time?
Production-to-Market Lead-time, also known simply as lead time, is the amount of time it takes to build and ship a product if all the materials are available. This includes all the manufacturing, sub-assembly, and assembly processes that impact the ability to process material into a product
How to Calculate Production-to-market Lead-time
Production-to-market Lead-time = order delivery date - order received date
Profit Per Employee
What is Profit Per Employee?
Profit Per Employee is the measure of net Income for the past twelve months divided by the current number of full-time equivalent employees.
How to Calculate Profit Per Employee
Profit Per Employee = net income for the past twelve months / current number of full-time equivalent employees
Return On Assets (ROA)
What is Return On Assets?
Return On Assets is a profitability ratio that provides how much profit a company is able to generate from its assets.
How to Calculate Return On Assets
Return On Assets = net income / average total assets
Revenue Per Employee
What is Revenue Per Employee?
Revenue Per Employee, similar to profit per employee, is a ratio that measures how much revenue each employee generates for the firm.
How to Calculate Revenue Per Employee
Revenue Per Employee = total revenue / current number of employees
Schedule Attainment
What is Schedule Attainment?
Schedule Attainment is the the percentage of time a target level of production is attained within a specified schedule of time. It essentially measures the amount of output produced in relation to the plan.
How to Calculate Schedule Attainment
Schedule Attainment = (actual production output in units / target production output in units) x 100
Scrap Rate
What is Scrap Rate?
Scrap Rate is the percentage of failed assemblies or material that cannot be repaired or restored, and is therefore condemned and discarded, which represents a cost to the organization.
How to Calculate Scrap Rate
Scrap Rate = scrap material / total materials intake (amount of material put into the process)
Takt Time
What is Takt Time?
Takt Time is the required product assembly duration that is needed to match the demand. It helps manufacturers ensure that their capacity matches the existing customer demand.
How to Calculate Takt Time
Takt Time = workable production hours / units required (customer demand)
Throughput
What is Throughput?
Throughput is the amount of material or items passing through a system or process.
How to Calculate Throughput
Throughput Rate = total good units produced / time
Time To Productivity
What is Time To Productivity?
Time To Productivity is how long it takes a new hire to contribute to an organization.
How to Calculate Time To Productivity
Time To Productivity = date that new hire achieves productivity - start date of new hire
Total Cycle Time
What is Total Cycle Time?
Total Cycle Time is the total time from when an operation begins to when the operation ends.
How to Calculate Total Cycle Time
Total Cycle Time = end time of operation – start time of operation
Total Manufacturing Cost Per Unit Excluding Materials
What is Total Manufacturing Cost Per Unit Excluding Materials?
Total Manufacturing Cost Per Unit Excluding Materials is a measure of all potentially controllable manufacturing costs that go into the production of a given manufactured unit, item, or volume
How to Calculate Total Manufacturing Cost Per Unit Excluding Materials
Total Manufacturing Cost Per Unit Excluding Materials = (total manufacturing costs - cost of materials) / total number of units produced
Unscheduled Downtime
What is Unscheduled Downtime?
Unscheduled Downtime is any period in which a system is unavailable that was not previously planned.
How to Calculate Unscheduled Downtime
Unscheduled Downtime is simply the sum of all unscheduled downtime within a given period
Unused Capacity Expenditures
What is Unused Capacity Expenditures?
Unused Capacity Expenditures measures how much available capacity from machines and people was supported but went unused.
How to Calculate Unused Capacity Expenditures
Unused Capacity Expenditures is simply the sum of any unused capacity within a given period.
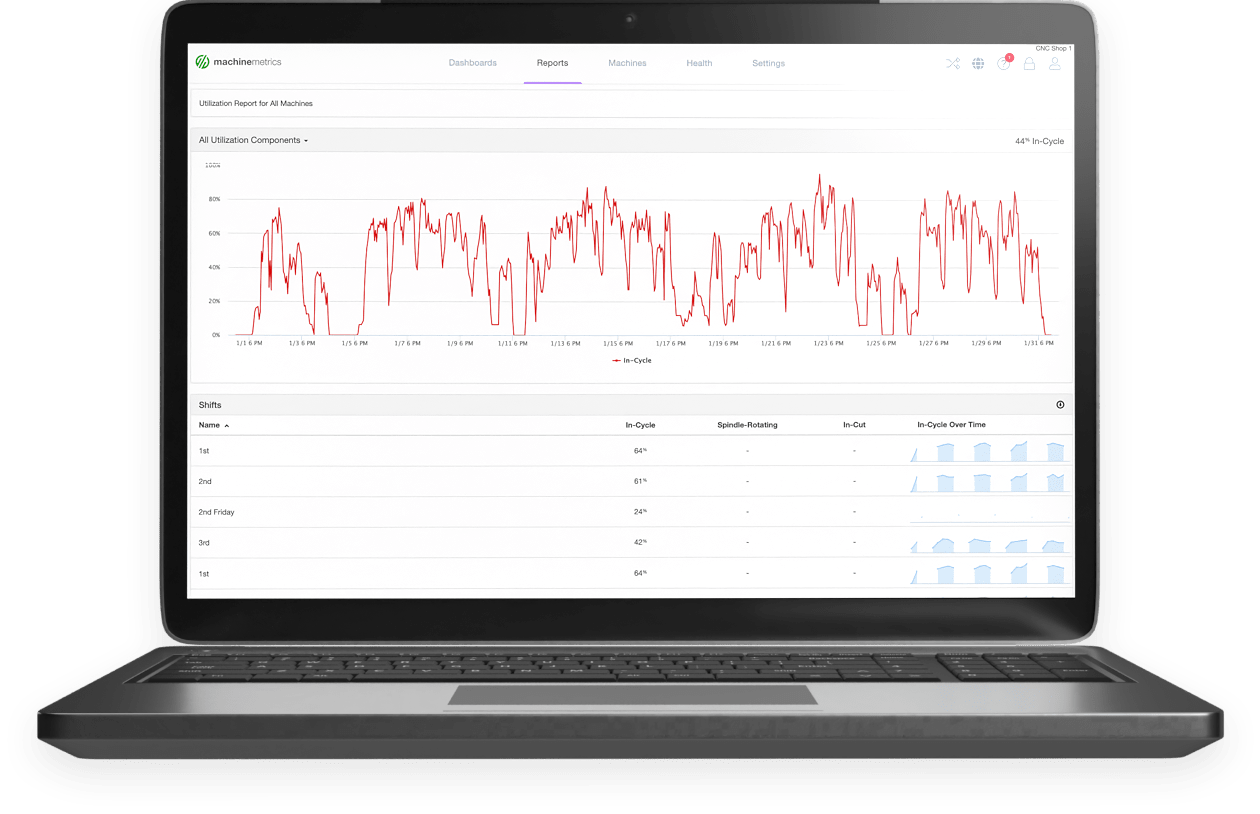
Utilization
What is Utilization?
Utilization is the proportion of time that manufacturing equipment is used. It essentially measures how much of a manufacturing operation’s potential output is being met.
How to Calculate Utilization
Utilization = (plant output in a given time period x 100) / maximum output in a given time period
Work-in-Process (WIP)
What is Work-in-Process?
Work-in-process is a company's partially finished goods waiting for completion and eventual sale. It includes raw materials, labor, and overhead costs associated with products that are in mid-production.
How to Calculate Work-in-Process
Work-in-Process (Wip) = WIP inventory at beginning of period + WIP purchased during period - WIP inventory at end of period + labor costs + manufacturing overhead
Manufacturing Cycle Efficiency
What is Manufacturing Cycle Efficiency?
Manufacturing Cycle Efficiency is the proportion of production time spent on value-added activities. To reduce costs, manufacturers can identify activities that are not adding value to the operation.
How to Calculate Manufacturing Cycle Efficiency
Manufacturing Cycle Efficiency = value-added production time / total cycle time
Rolling Throughput Yield (RTY)
What is Rolling Throughput Yield?
Rolling Throughput Yield is the probability that a process with more than one step will produce a defect free unit. It is a similar manufacturing KPI to that of first pass yield, but takes into consideration rework. You can calculate Rolling Throughput Yield by multiplying the First Pass Yield of each process.
How to Calculate Rolling Throughput Yield
Rolling Throughput Yield = (First Pass Yield of Process A)*(First Pass Yield of Process B)*(First Pass Yield of Process C)
Unplanned Capacity Expenditure
What is Unplanned Capacity Expenditure?
Unplanned Capacity Expenditure is simply the unplanned expenses.
How to Calculate Unplanned Capacity Expenditure
Unplanned Capacity Expenditure = total capacity expenditures - planned capacity expenditures
Manufacturing KPI Dashboards, Reports, and Templates
Below, we provide a large variety of example production reports and manufacturing KPI dashboards from MachineMetrics. We offer these so you can get an idea of the data MachineMetrics can provide and run reports on, as well as for general inspiration if you are building reports and templates for your organization. You'll also get a good idea of manufacturing KPI examples through clean, helpful, and action-oriented KPI dashboards and reports.
Ready to connect your shop floor?
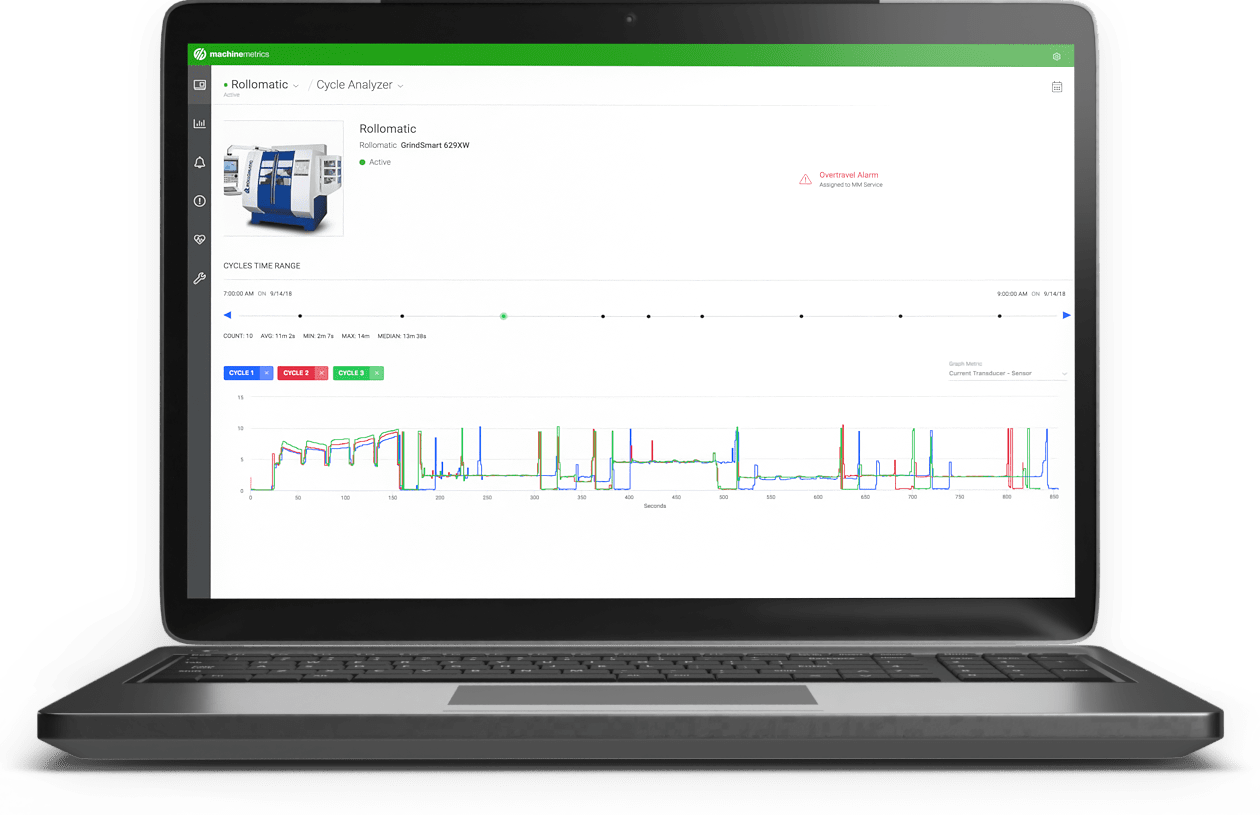
Cycle Time Dashboard
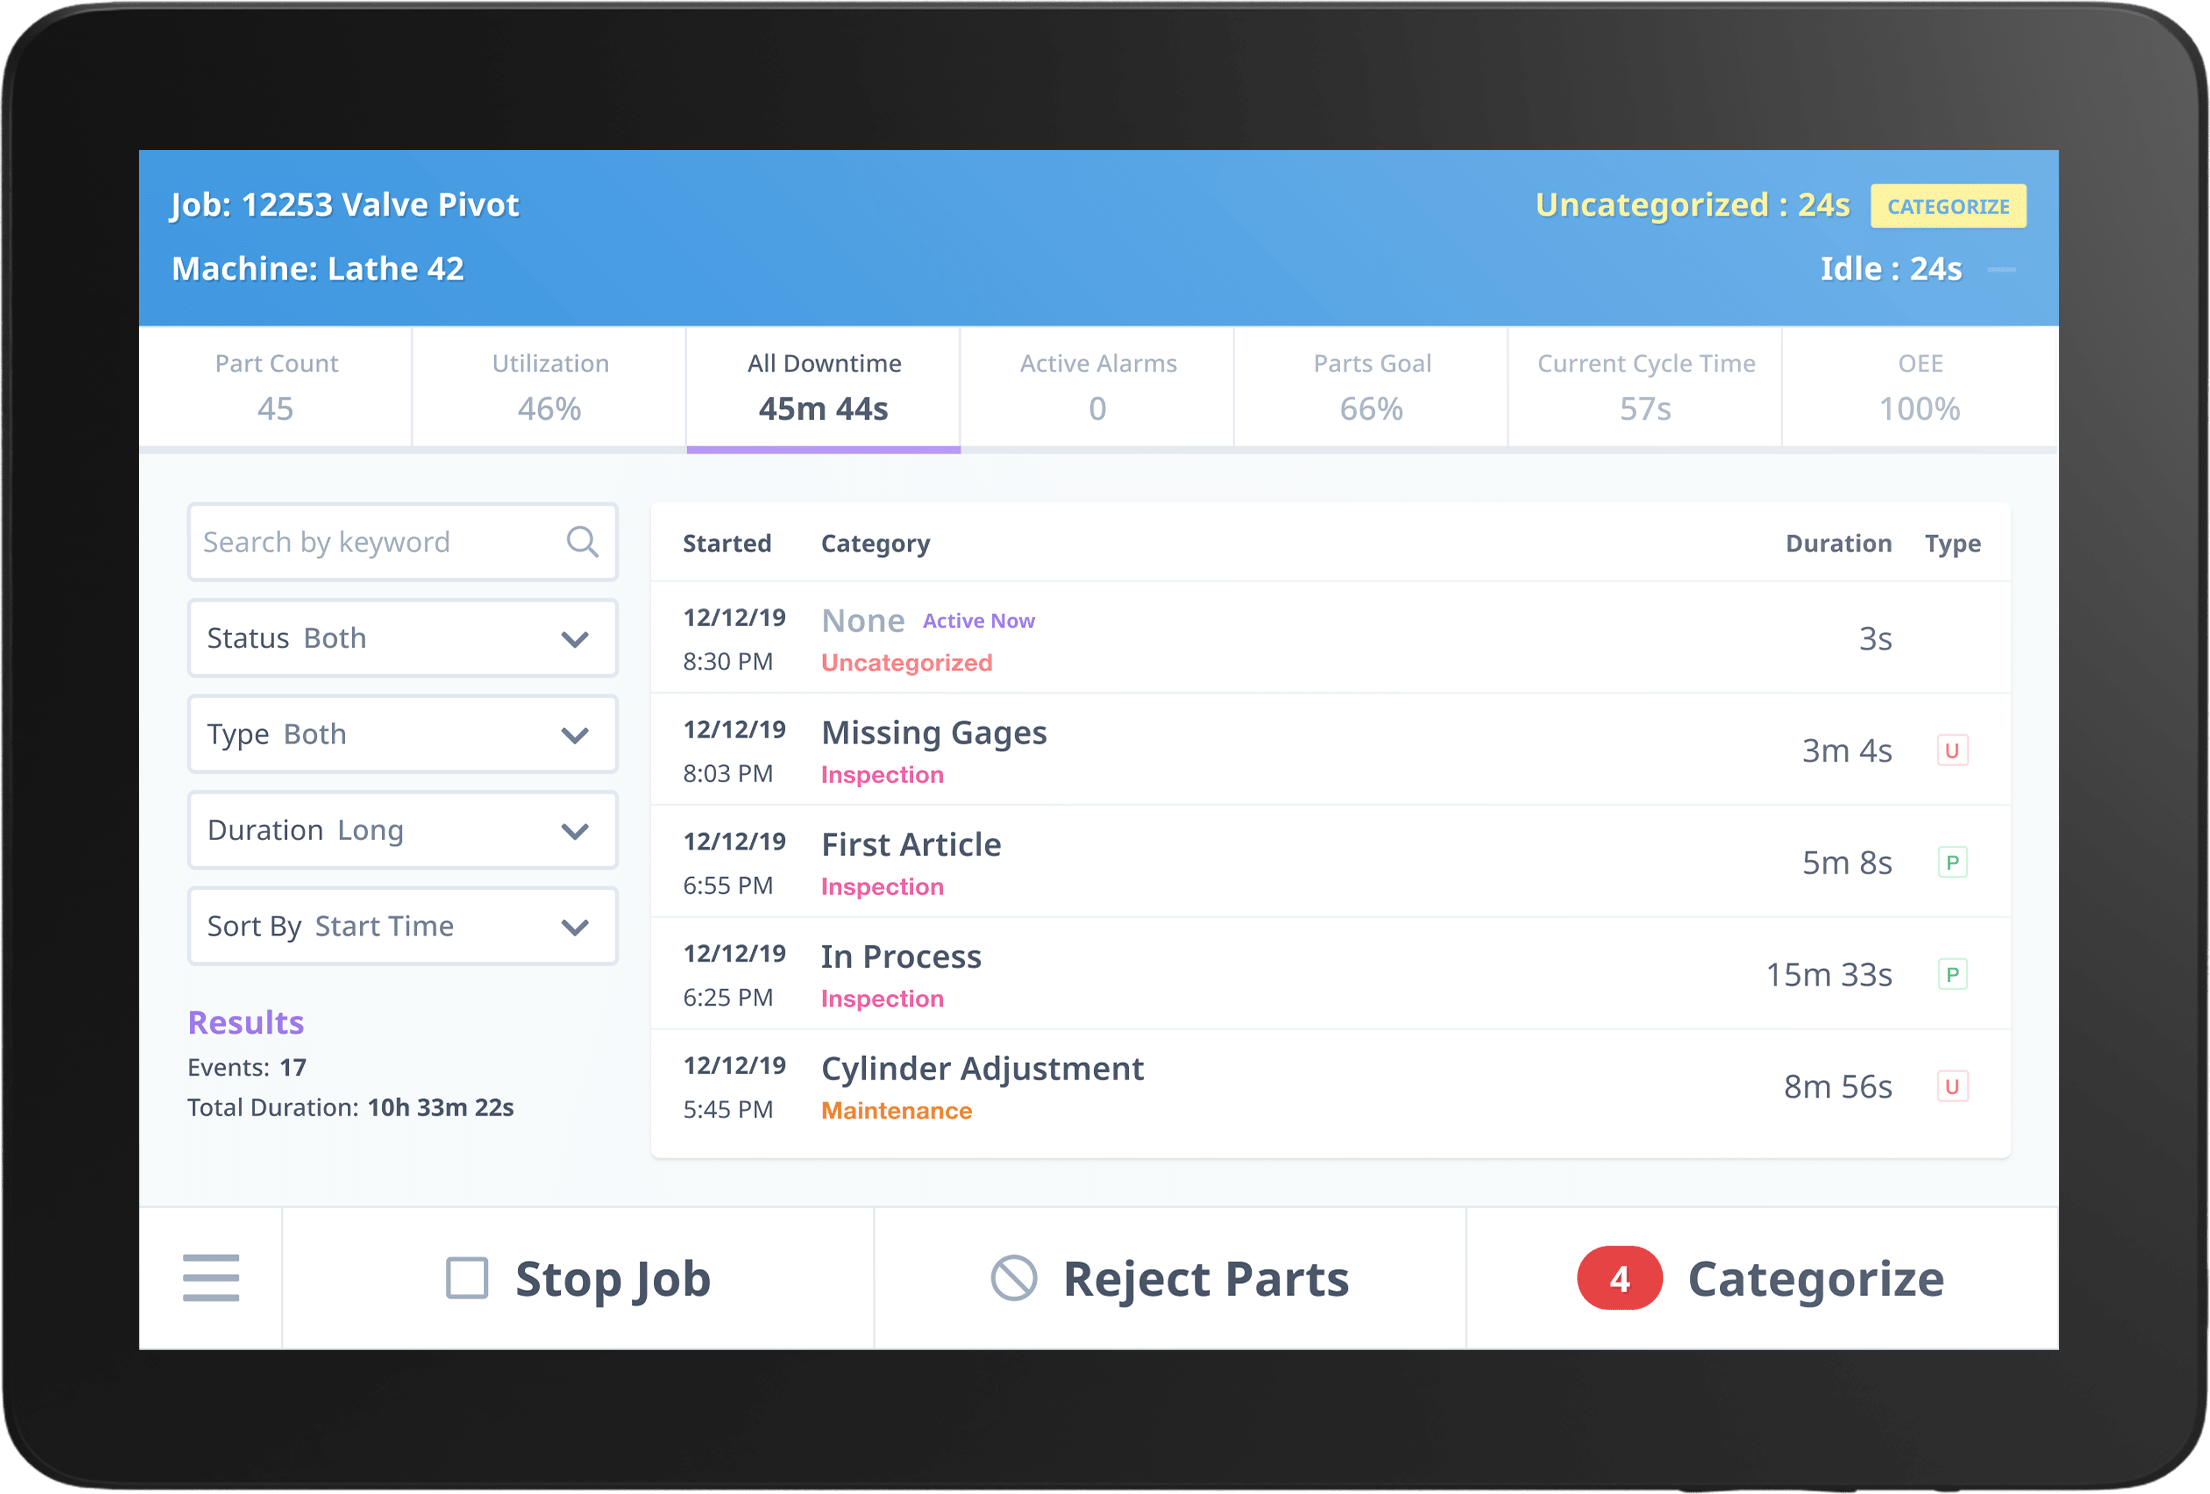
Downtime Report Dashboard
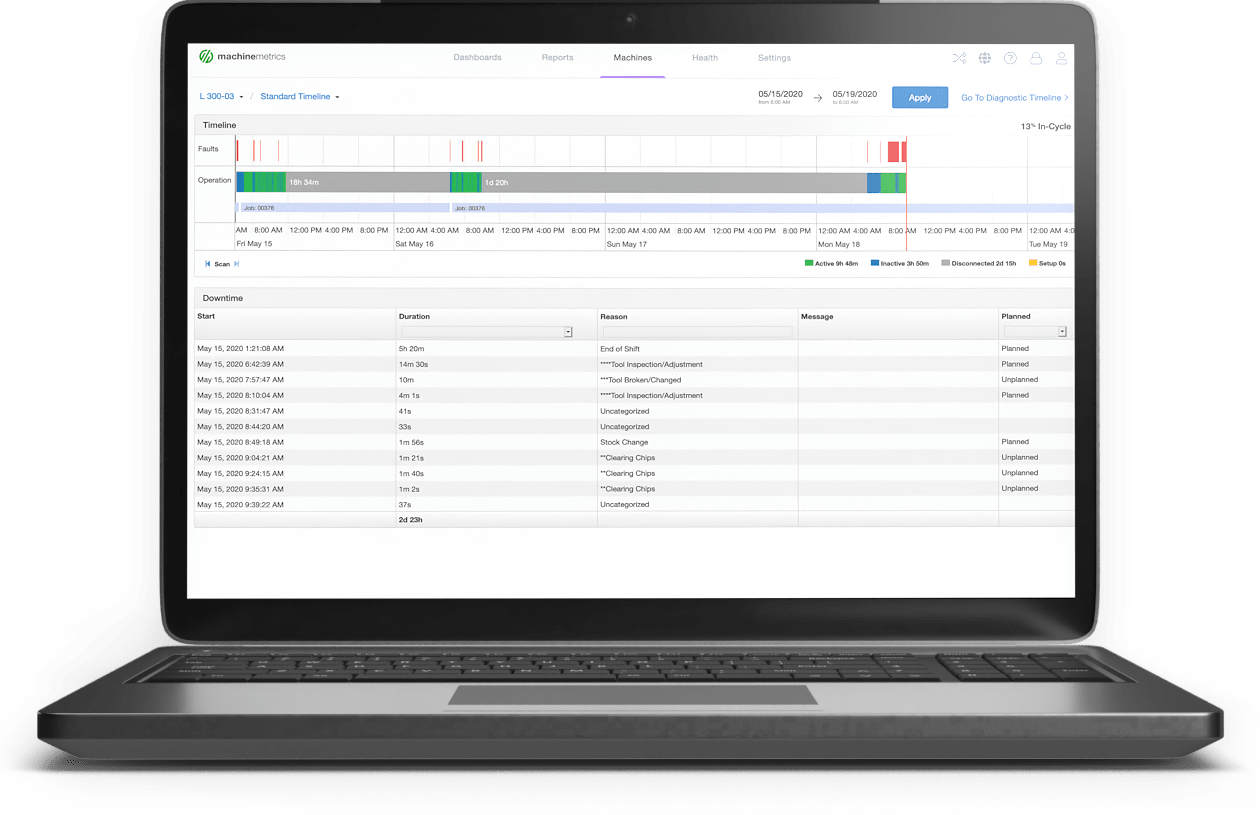
Machine Diagnostic Timeline Report
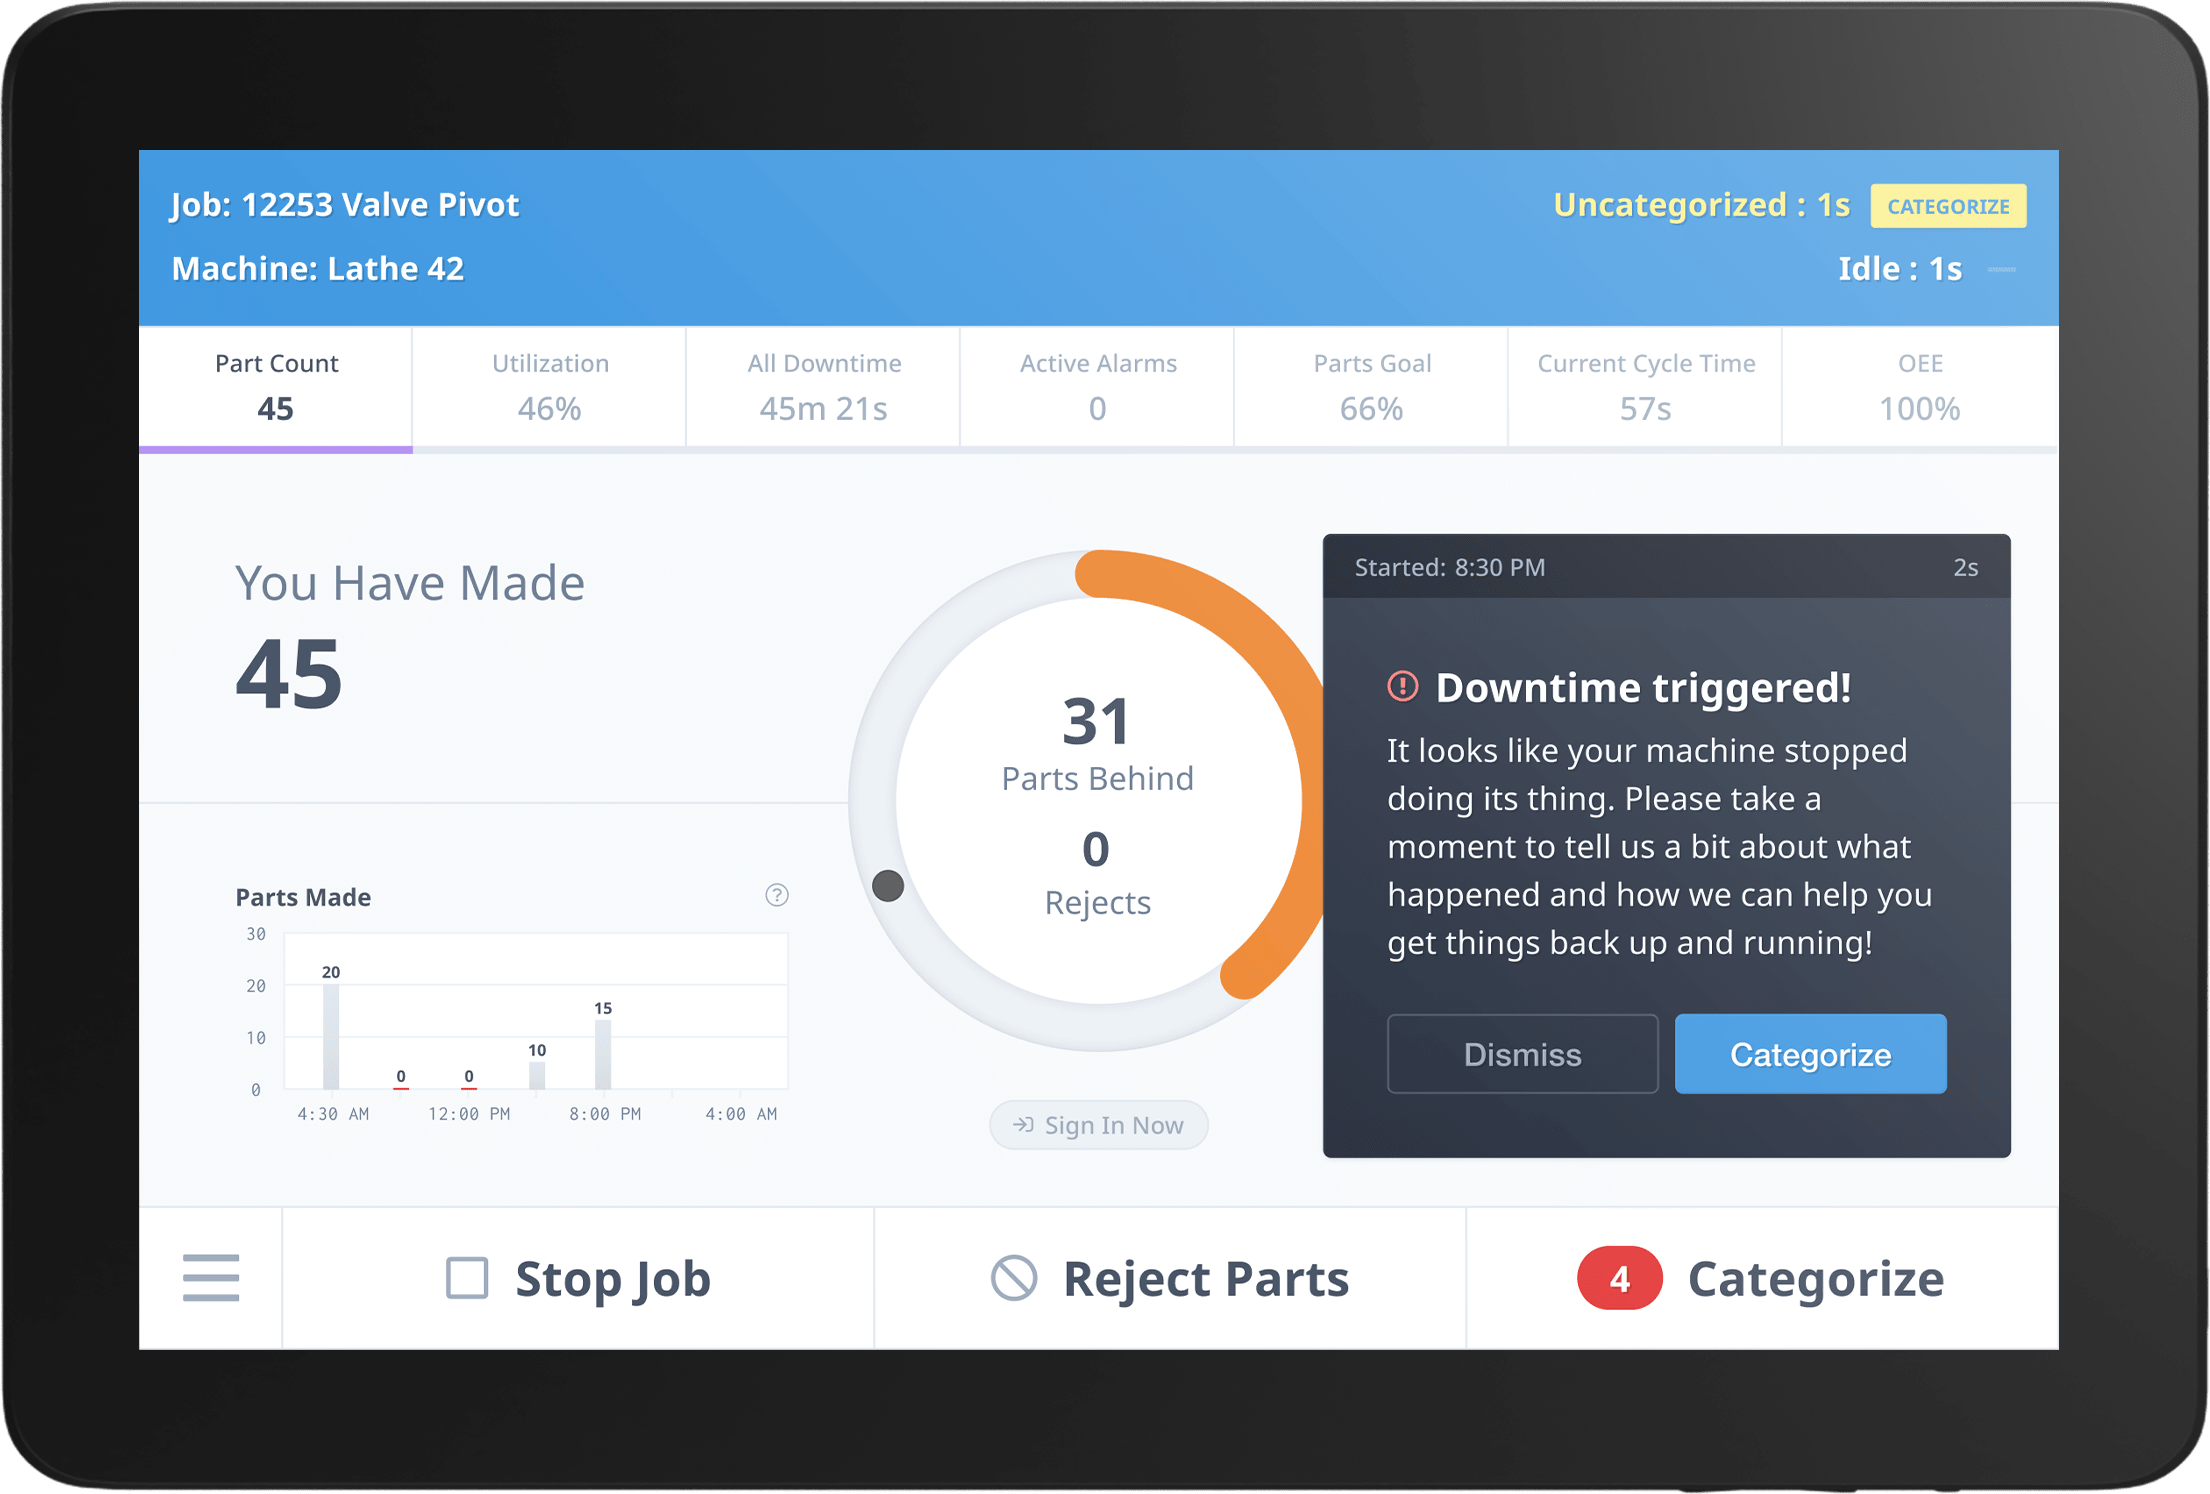
Machine Downtime Dashboard
Machine Health Dashboard
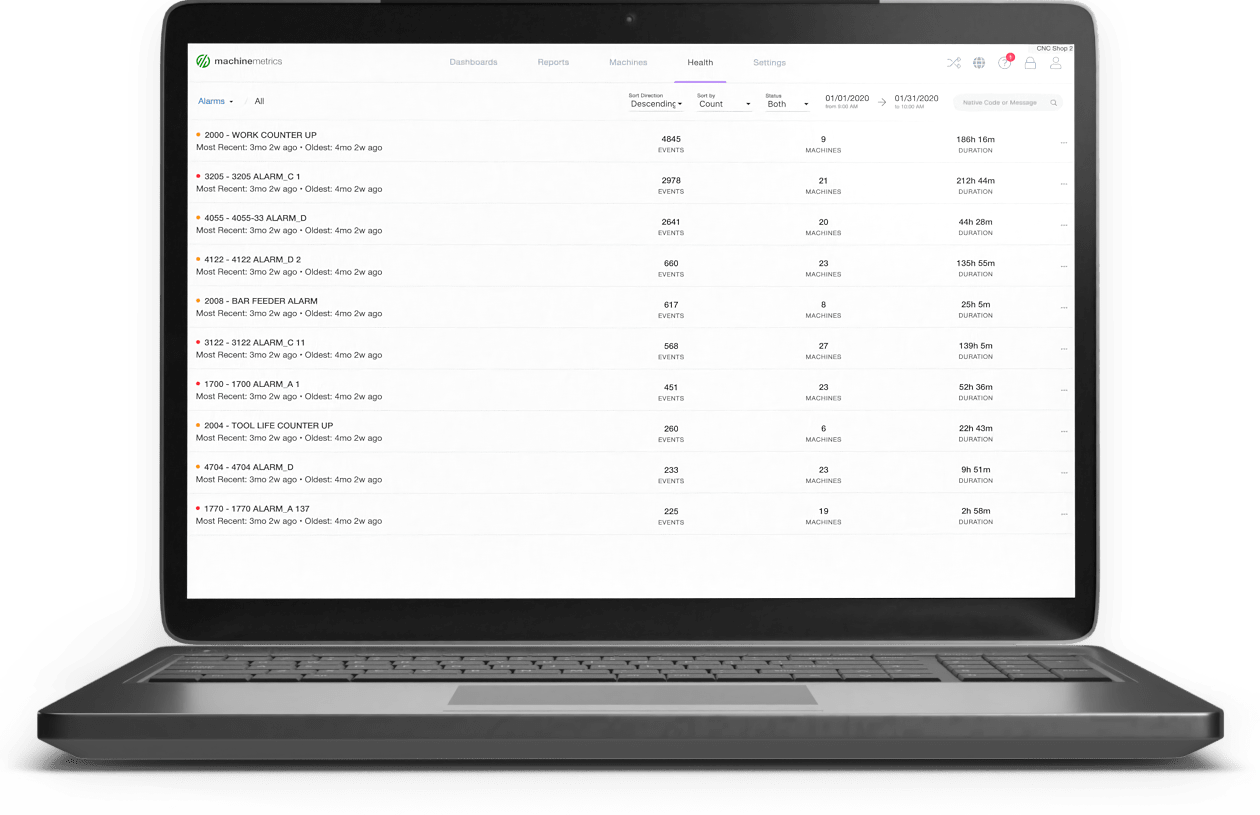
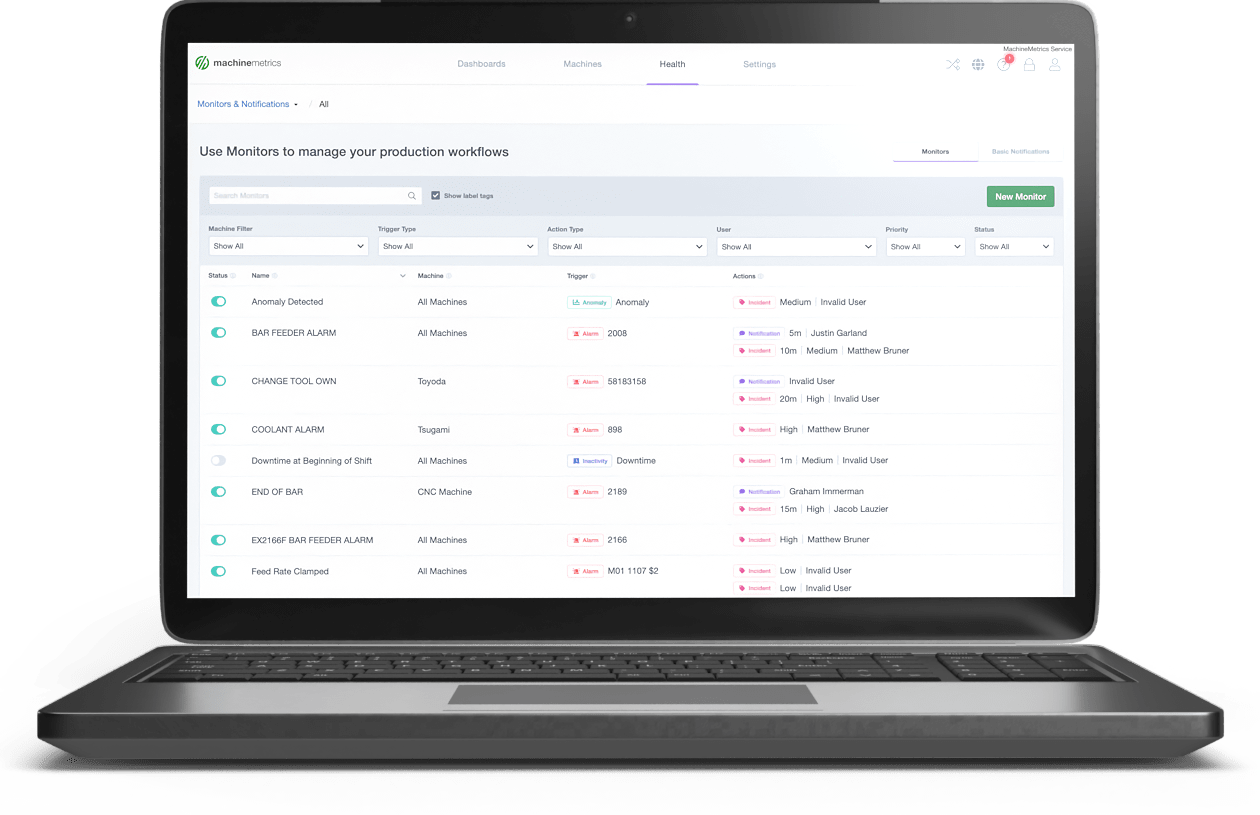
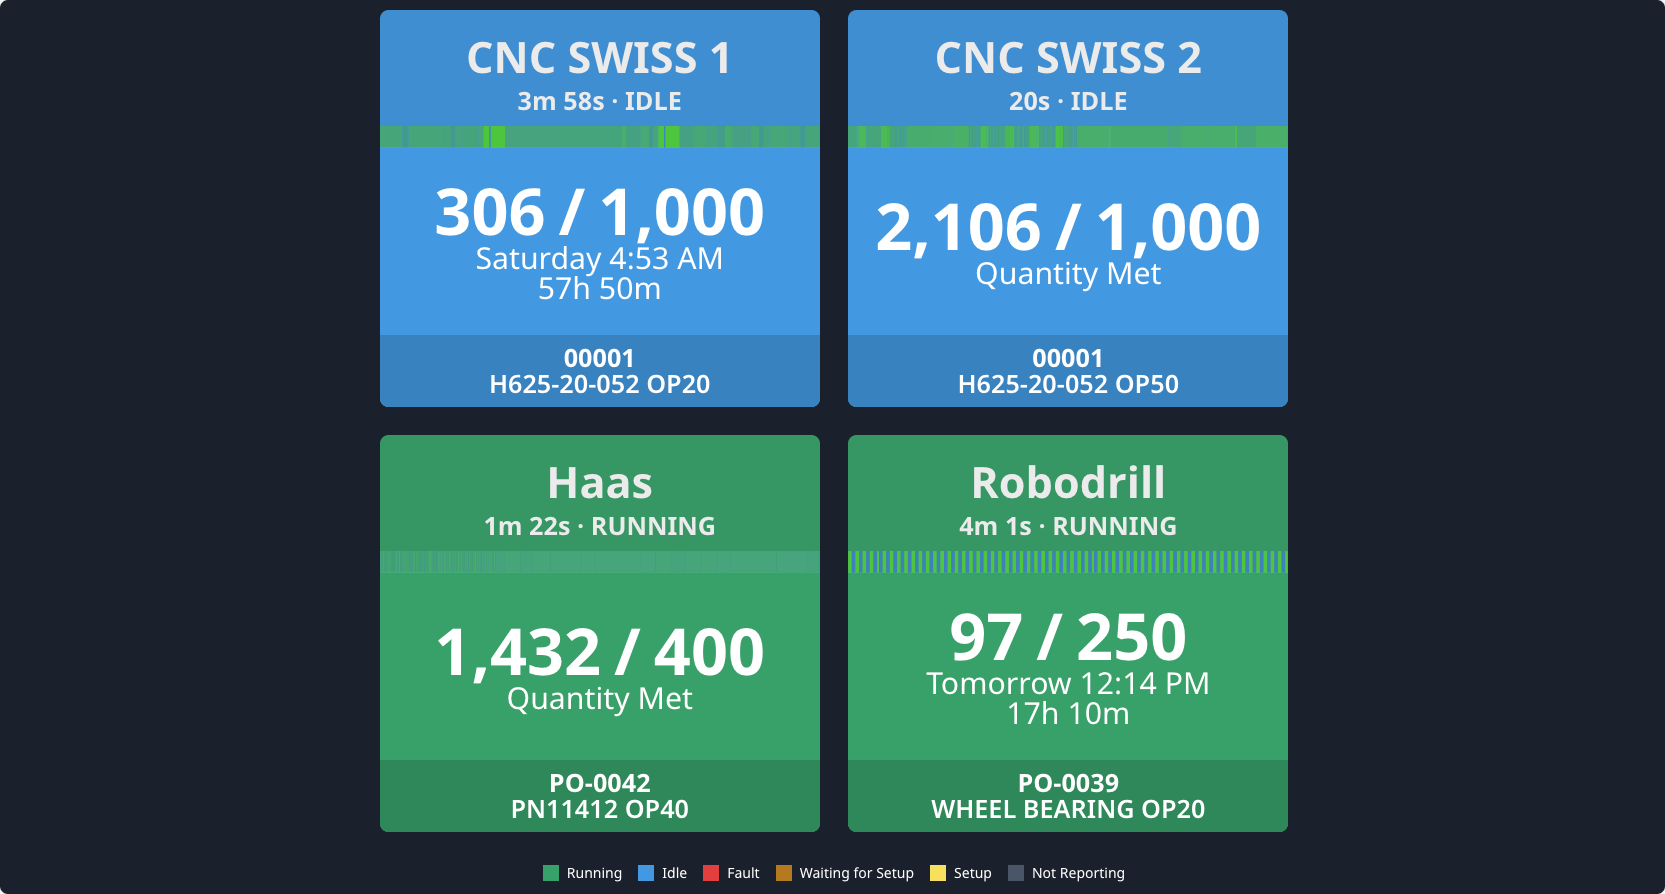
Machine Monitoring and Notifications Dashboards
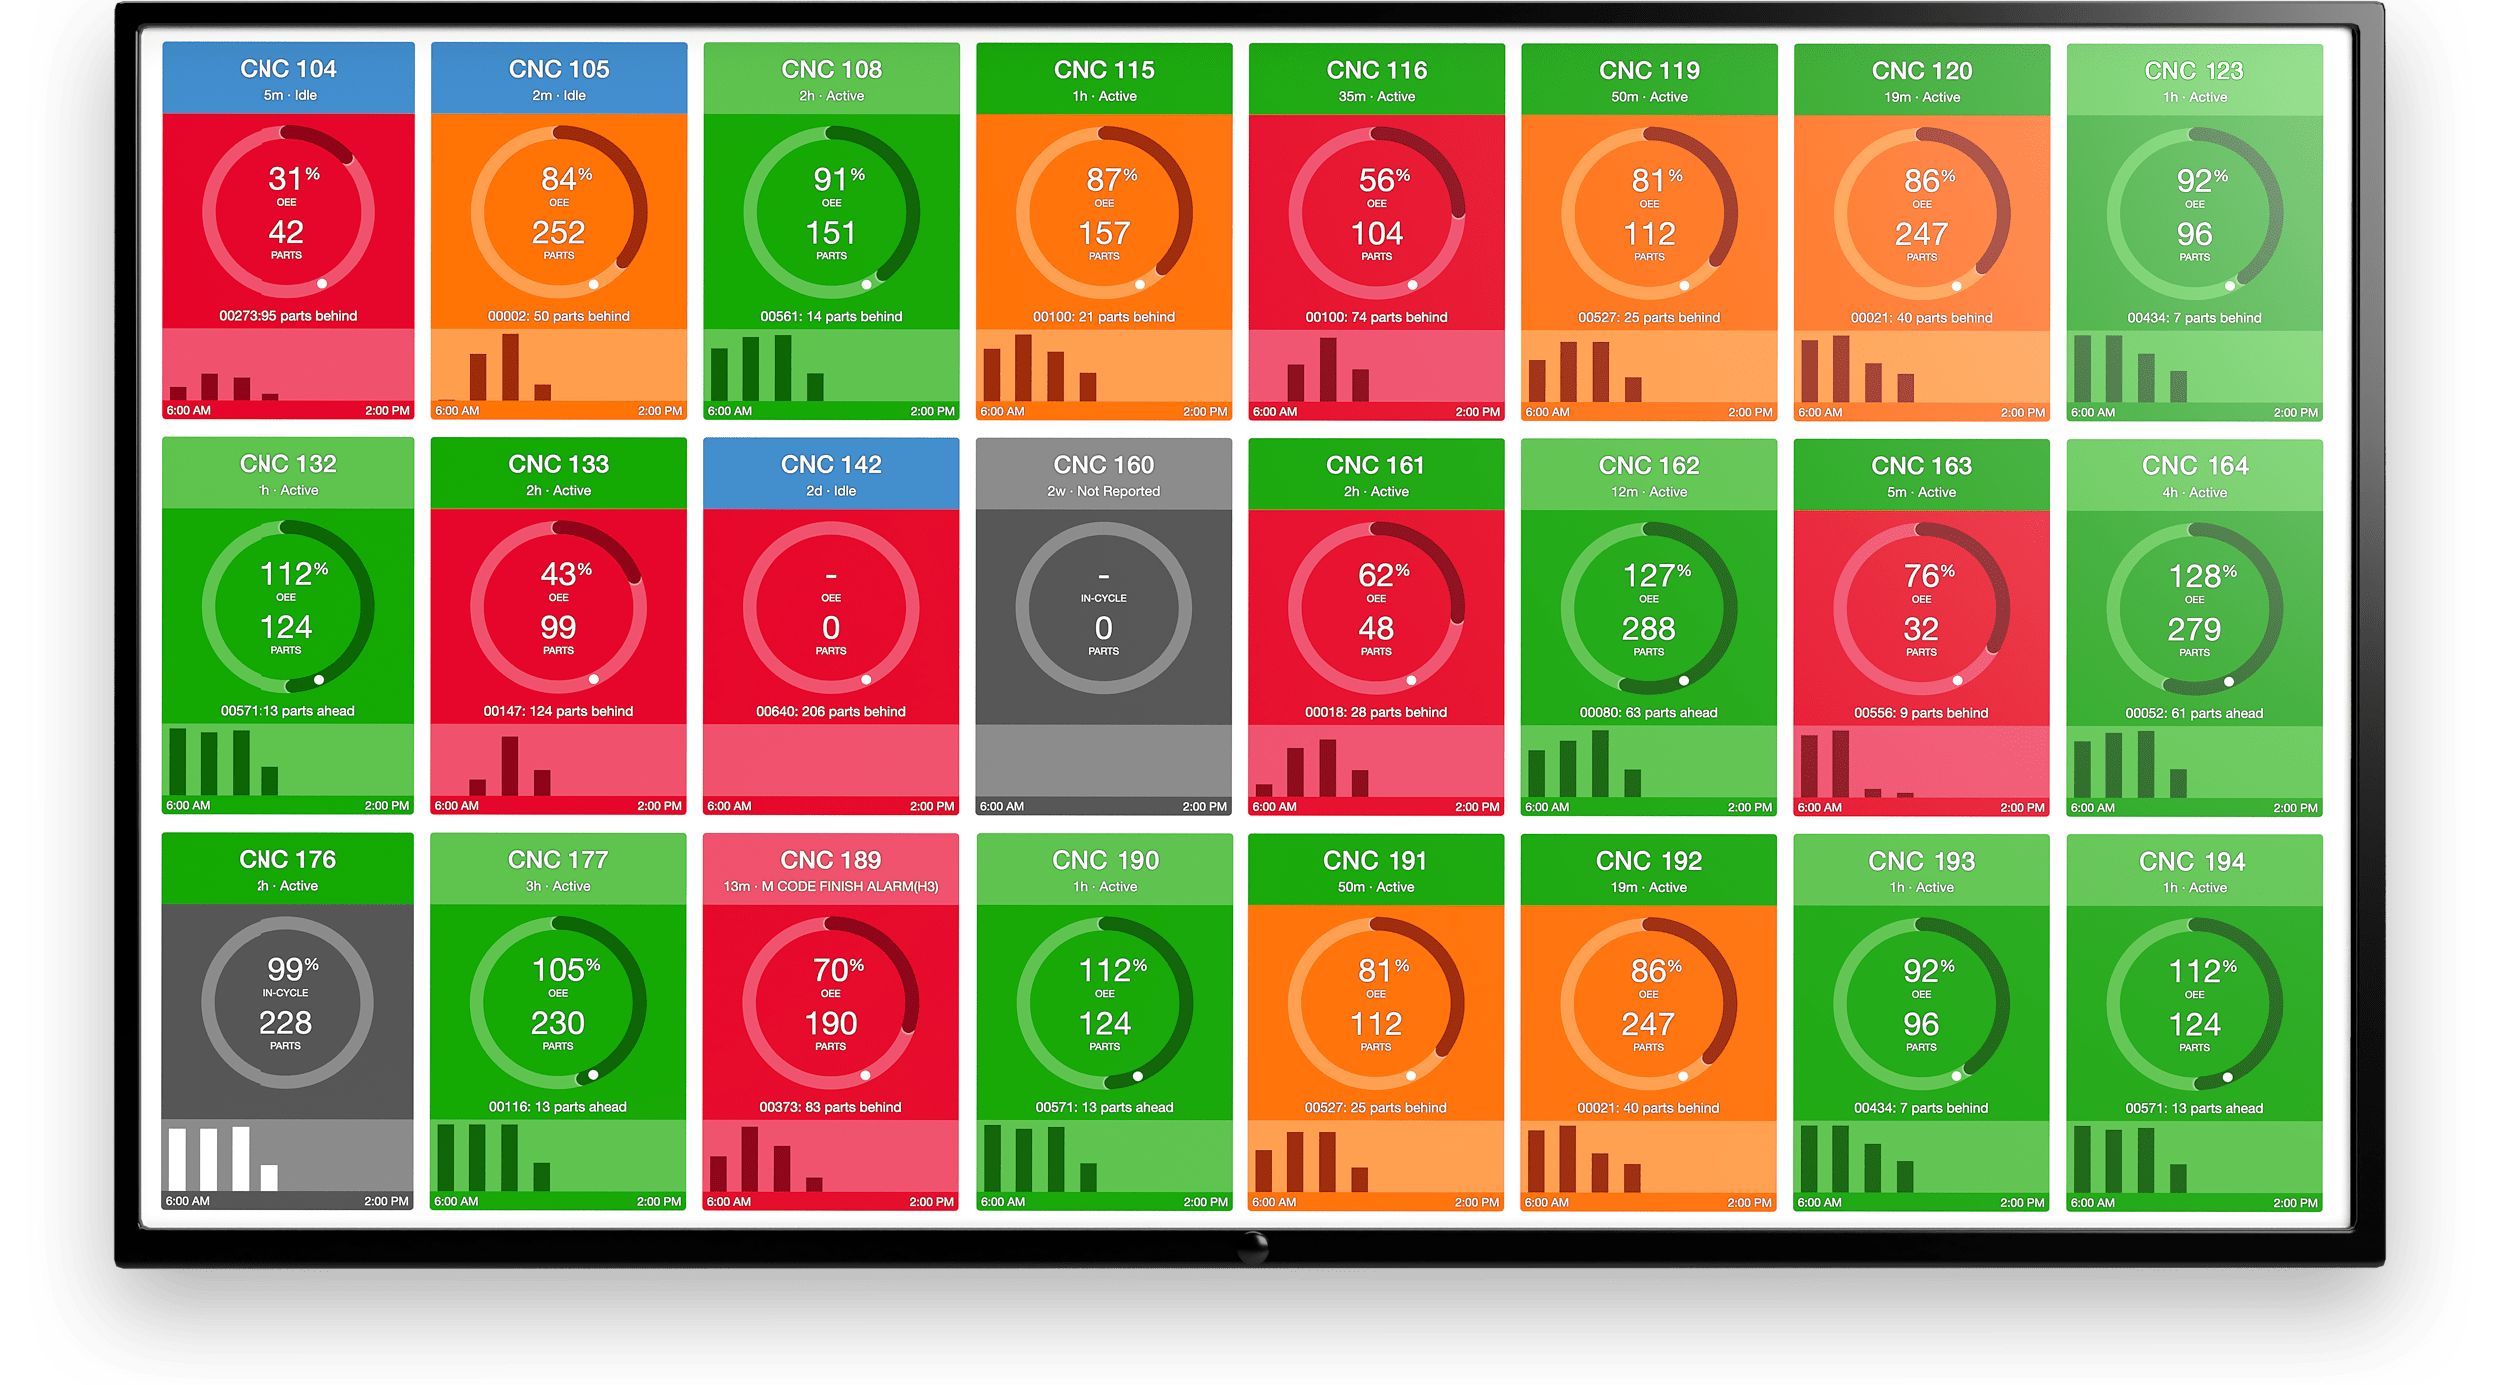
MachineMetrics Production Performance Dashboard
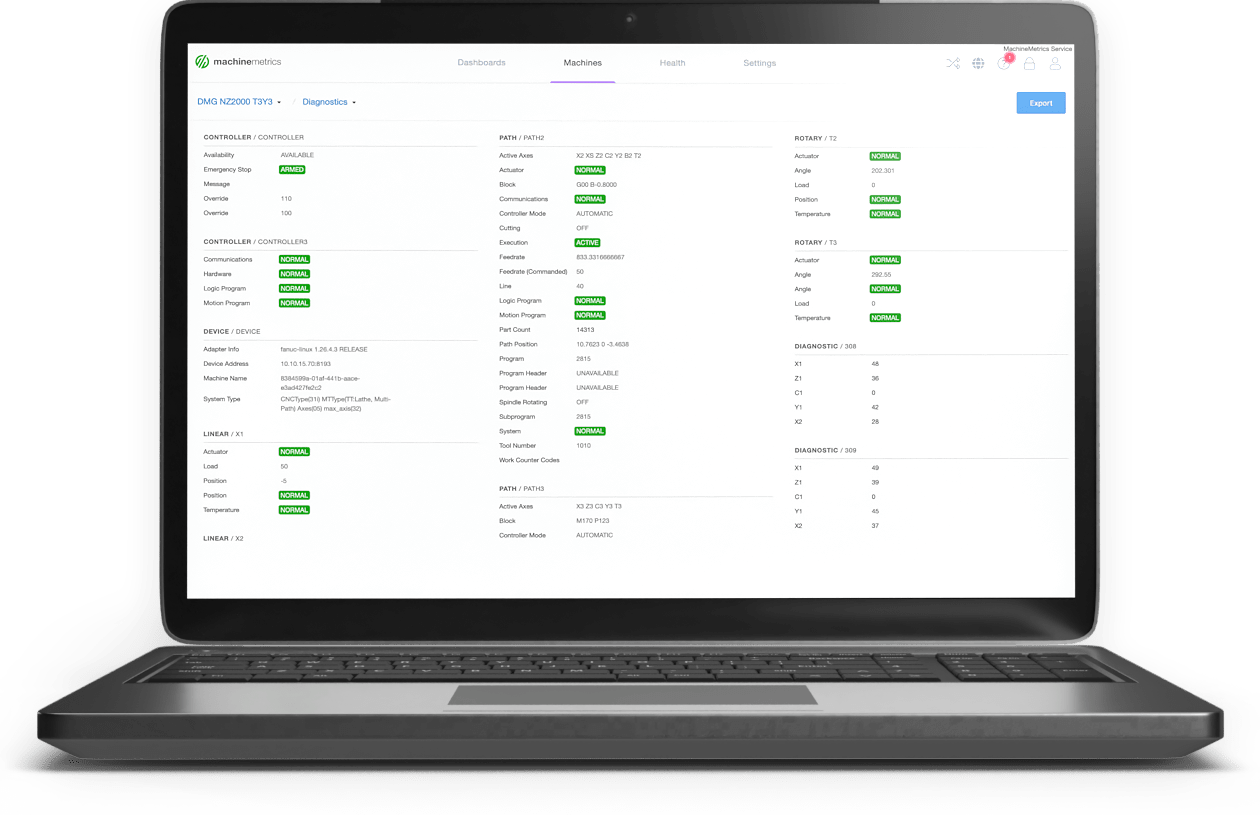
Manufacturing Machine Diagnostics Dashboard
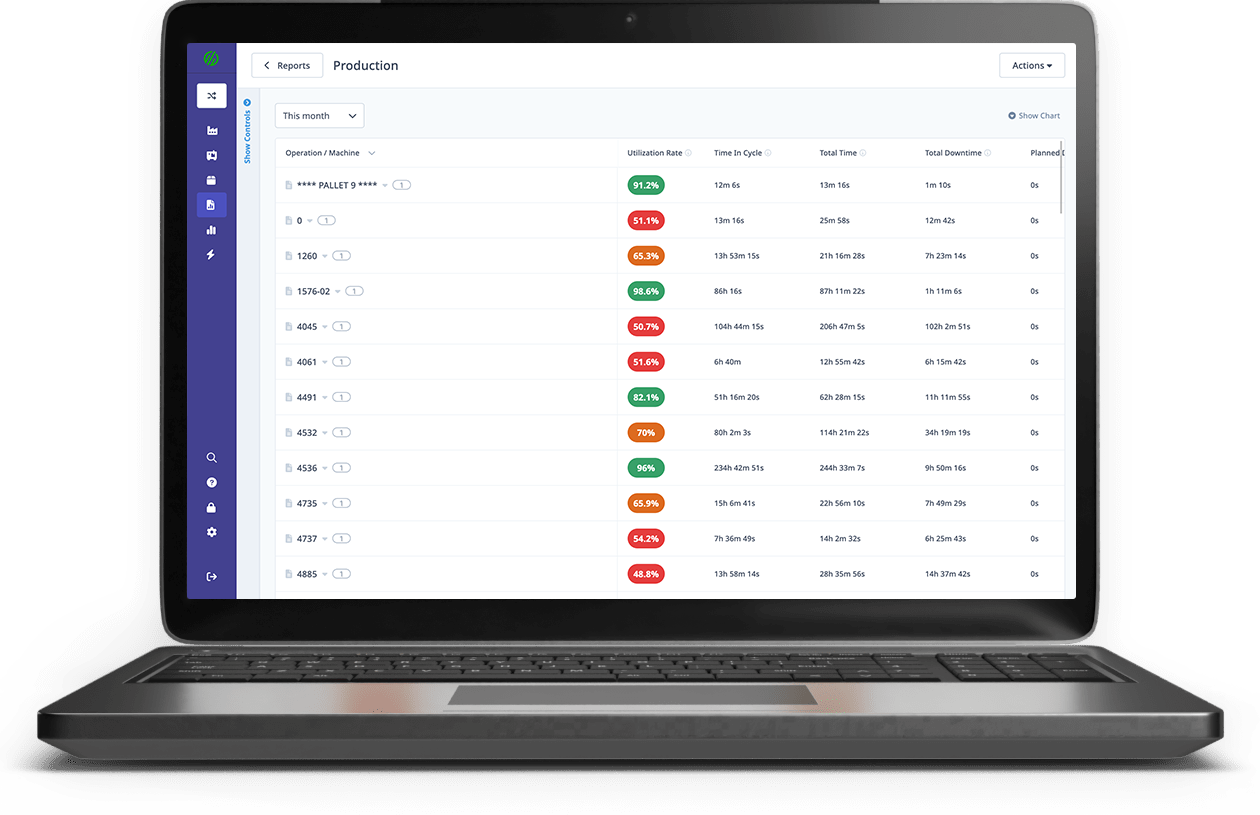
Manufacturing Production Report
OEE Dashboard
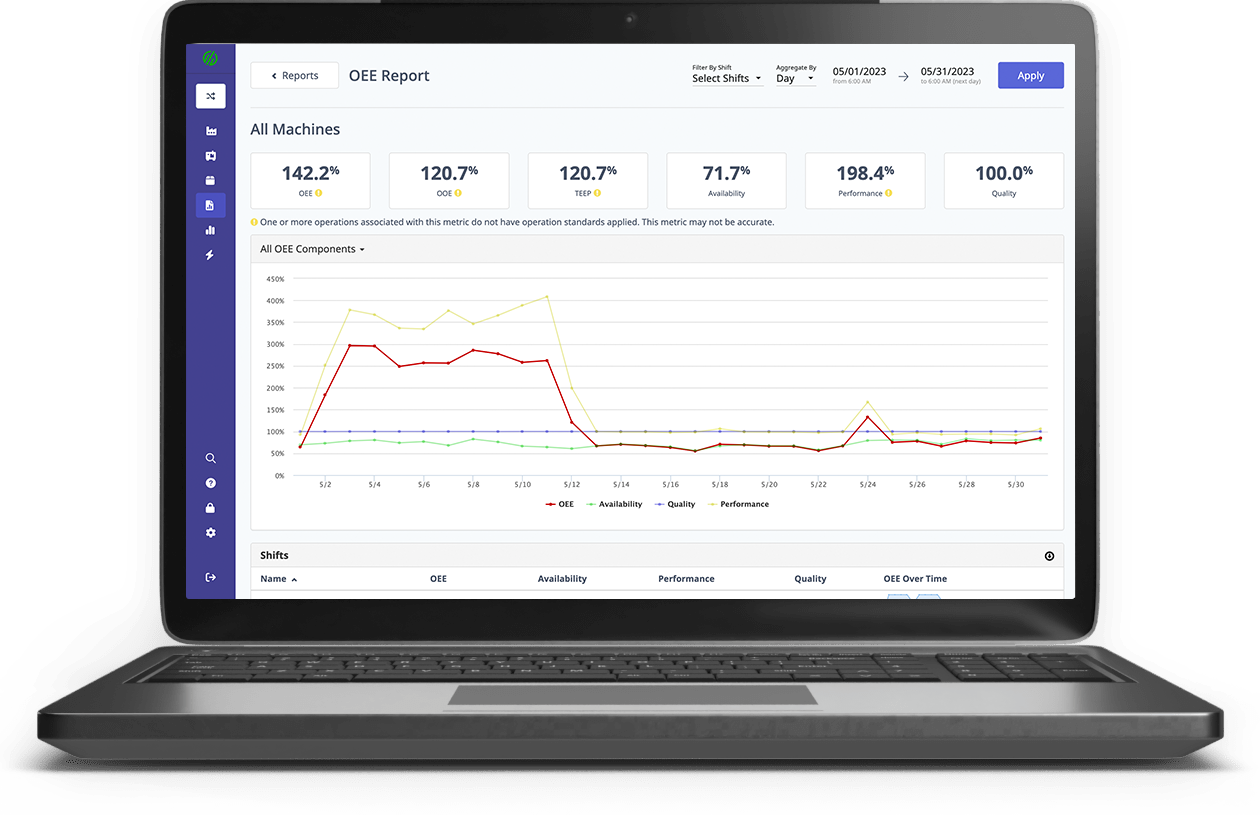
Learn more about OEE Dashboards.
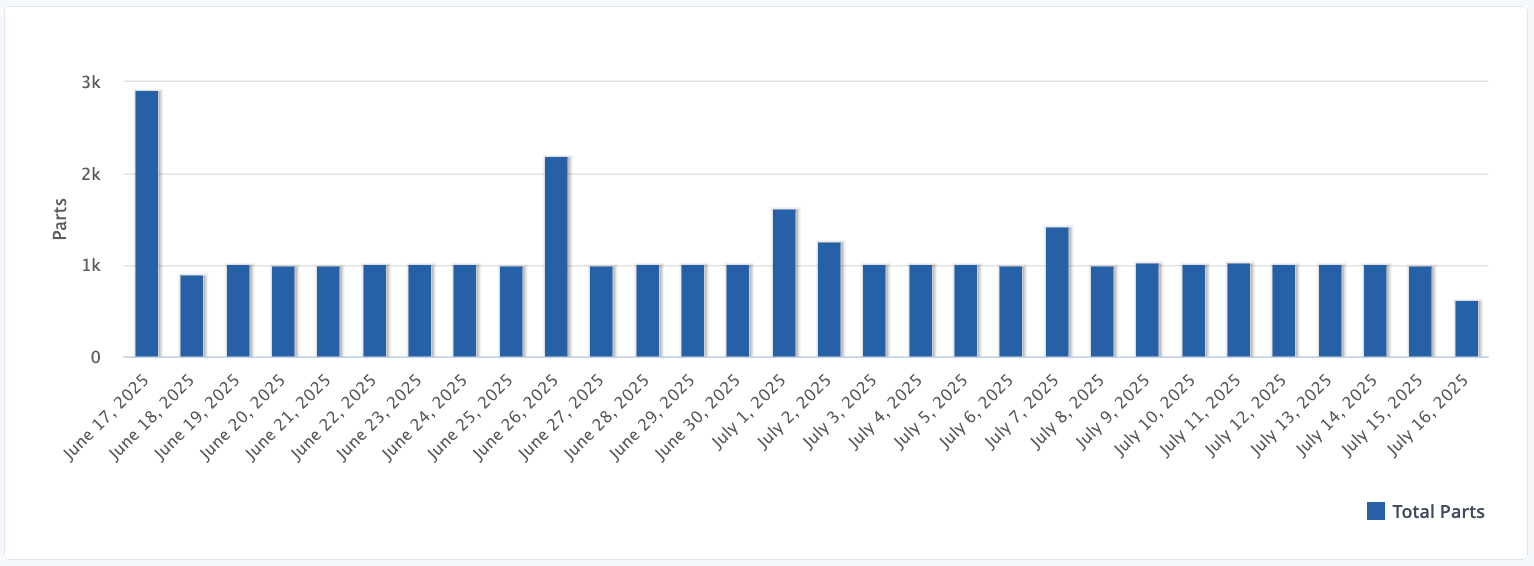
Part Production Dashboard
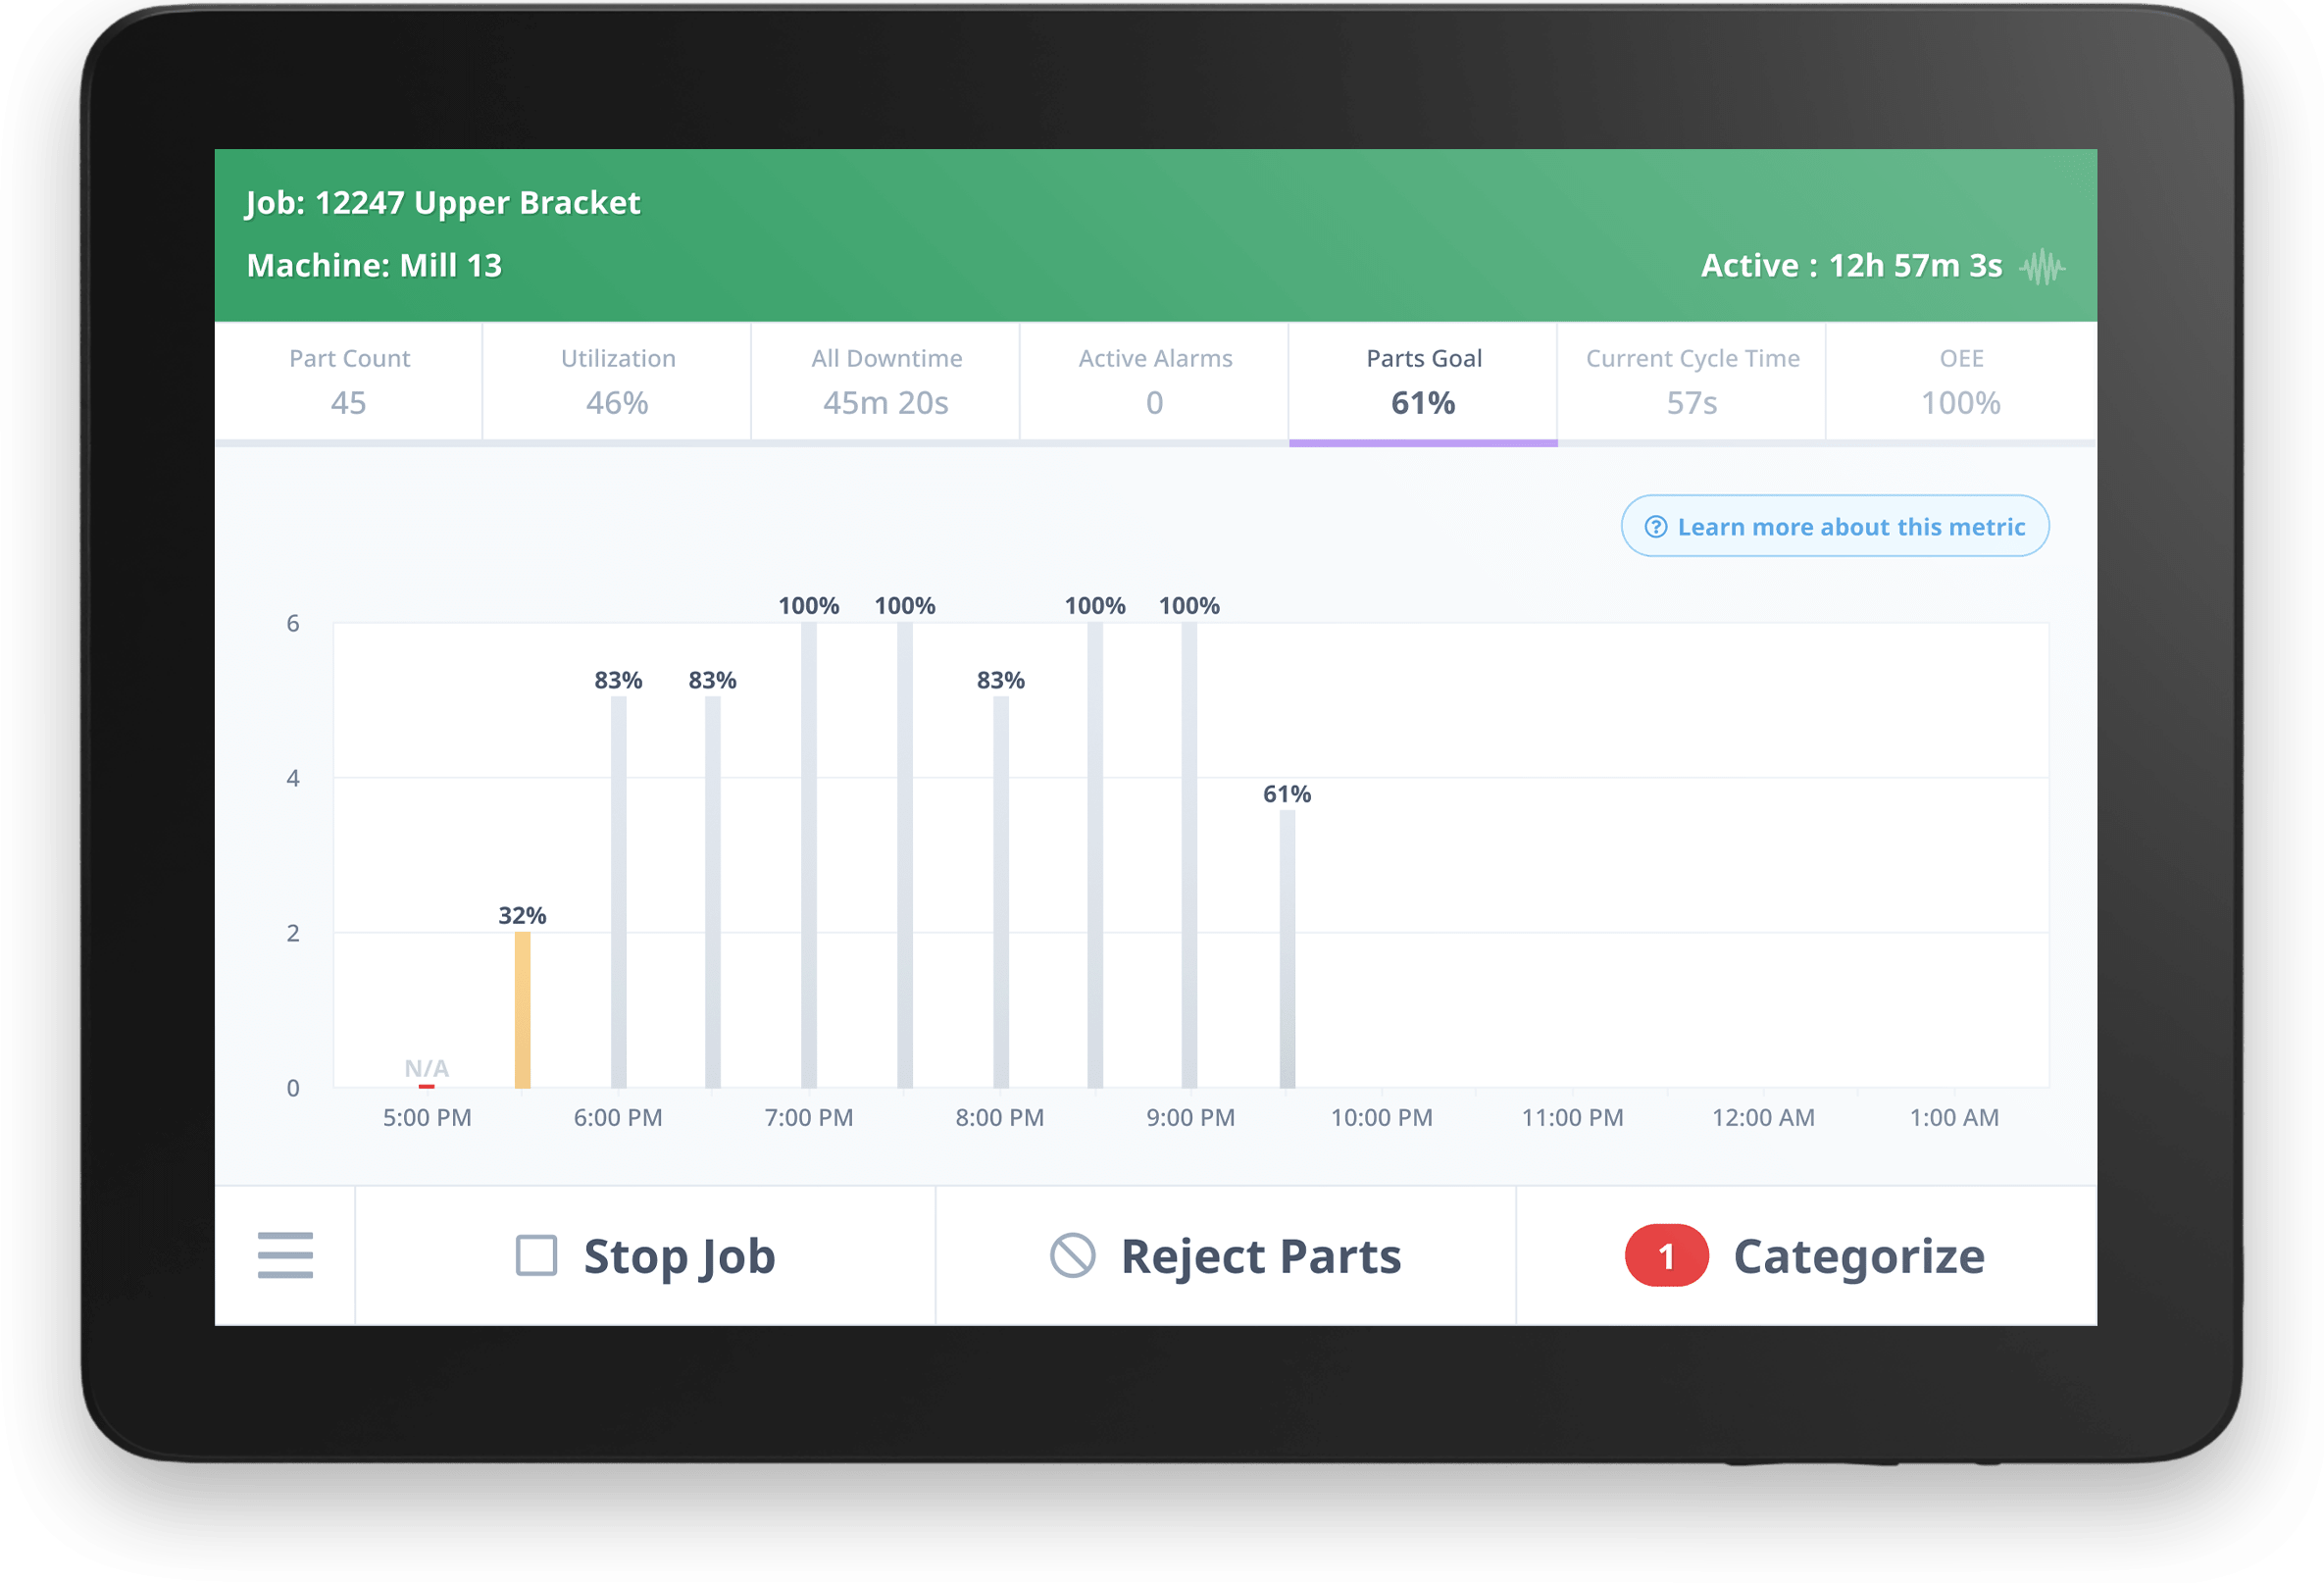
Part Quality Dashboard
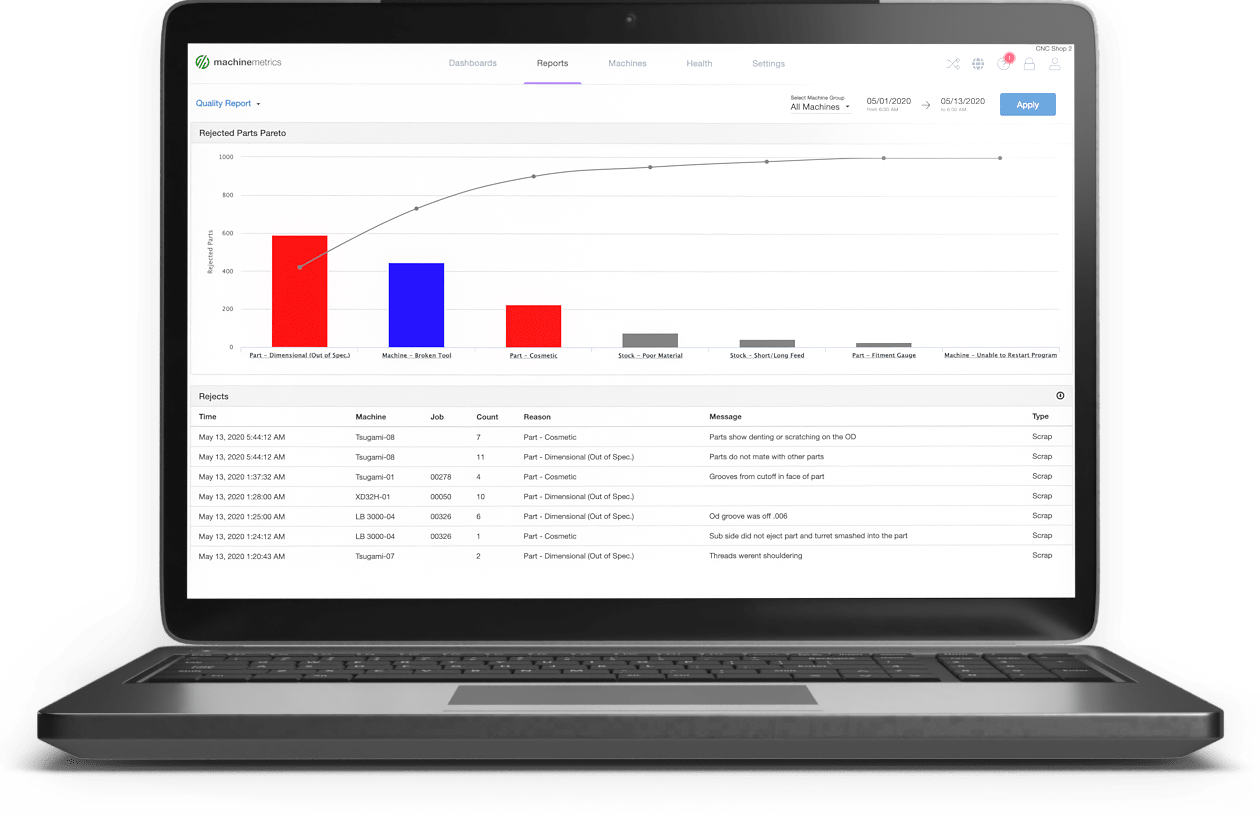
Part Quality Report
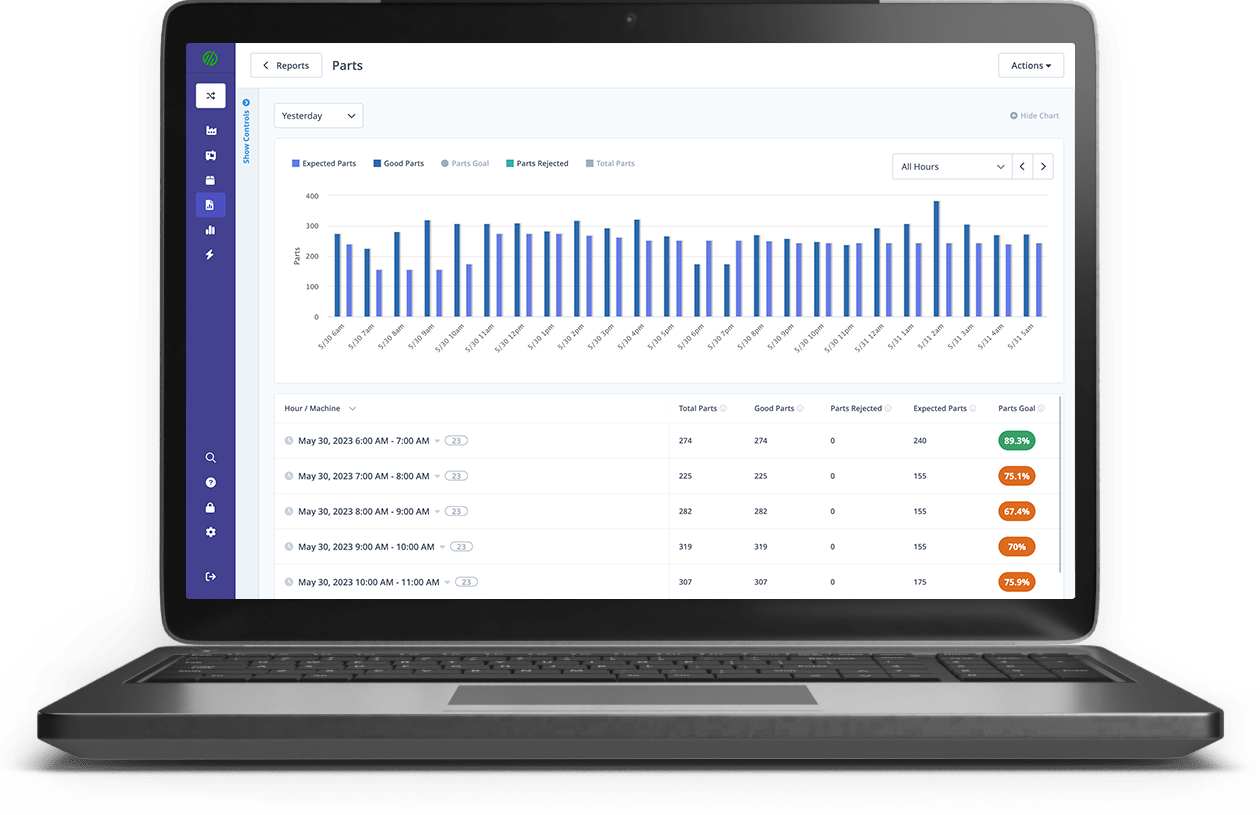
Preventative Maintenance Dashboard
Rejected Parts Dashboard
Utilization Report
Letting Manufacturing KPIs Guide You
Key performance indicators allow manufacturers to understand where they currently stand as well as the direction they are trying to go. Data analytics provide valuable insights into overall business performance, the extent of unused capacity, how to continue reducing costs, and so much more.
If you have made it this far, you may be interested in our guide on the manufacturing analytics journey, which documents how manufacturers can progress in their analytical maturity and drive more advanced manufacturing programs. Learn how you can move from descriptive to prescriptive analytics as you adopt advanced manufacturing strategies.

.png?width=1960&height=1300&name=01_comp_Downtime-%26-Quality_laptop%20(1).png)






Comments