Resolving Machine Downtimes Faster
Manufacturers are constantly looking for ways to produce more good parts, and one of the biggest barriers to this is machine downtime events.
With MachineMetrics, you can resolve both alarms and downtimes faster to reduce overall unplanned downtime and increase operator productivity.
In this guide, we will be sharing a variety of ways that MachineMetrics can enable your team to quickly resolve these issues to ensure machines are running as much as possible.
Using Real-Time Shop Floor Visibility
Knowing that a downtime event or alarm has occurred is the simplest way to resolve the problem as fast as possible. The only problem is that many manufacturers do not have accurate, real-time production data available.
Having machine data visibility is key to knowing exactly what is happening at any given time on the shop floor. And this is exactly how MachineMetrics can help.
MachineMetrics customers use large monitors to display production dashboards for the entire shop floor to see. Here’s what they look like:
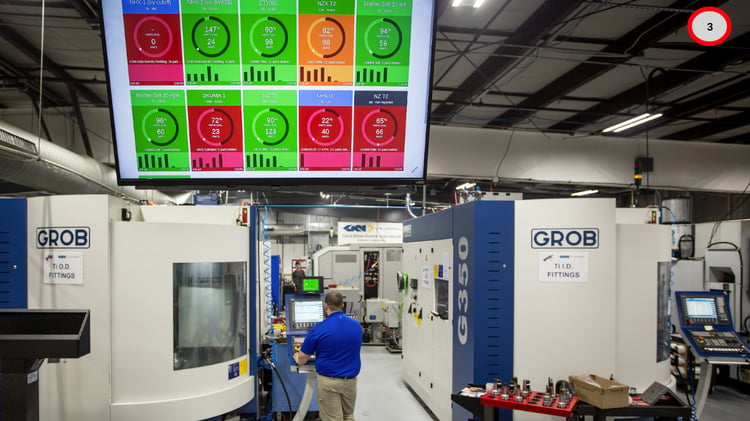
Each tile on the dashboard represents a machine, and is color-coded based on the performance of the machine. In this way, operators and managers can easily see when a machine is behind its production goals, or when the machine is experiencing a downtime event.
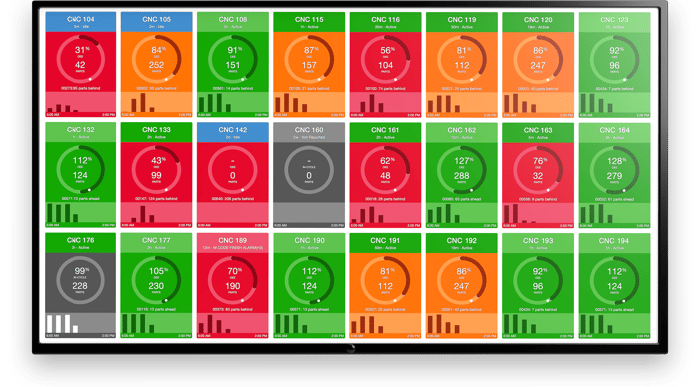 Not only does this instant visibility help operators and managers identify and respond to machine downtimes, the production dashboard typically results in a 10-20% increase in utilization for our customers.
Learn more about how the MachineMetrics Performance Dashboard increases productivity on the shop floor.
Leveraging Downtime Categorization and Alarms
The production dashboard is a simple and effective tool for accountability and visibility on the shop floor. Now we will move on to more advanced solutions for responding to downtimes.
Using additional data can improve response times to downtime events by enabling notifications and workflows.
Two ways MachineMetrics supports this is via downtime categorization and machine alarms.
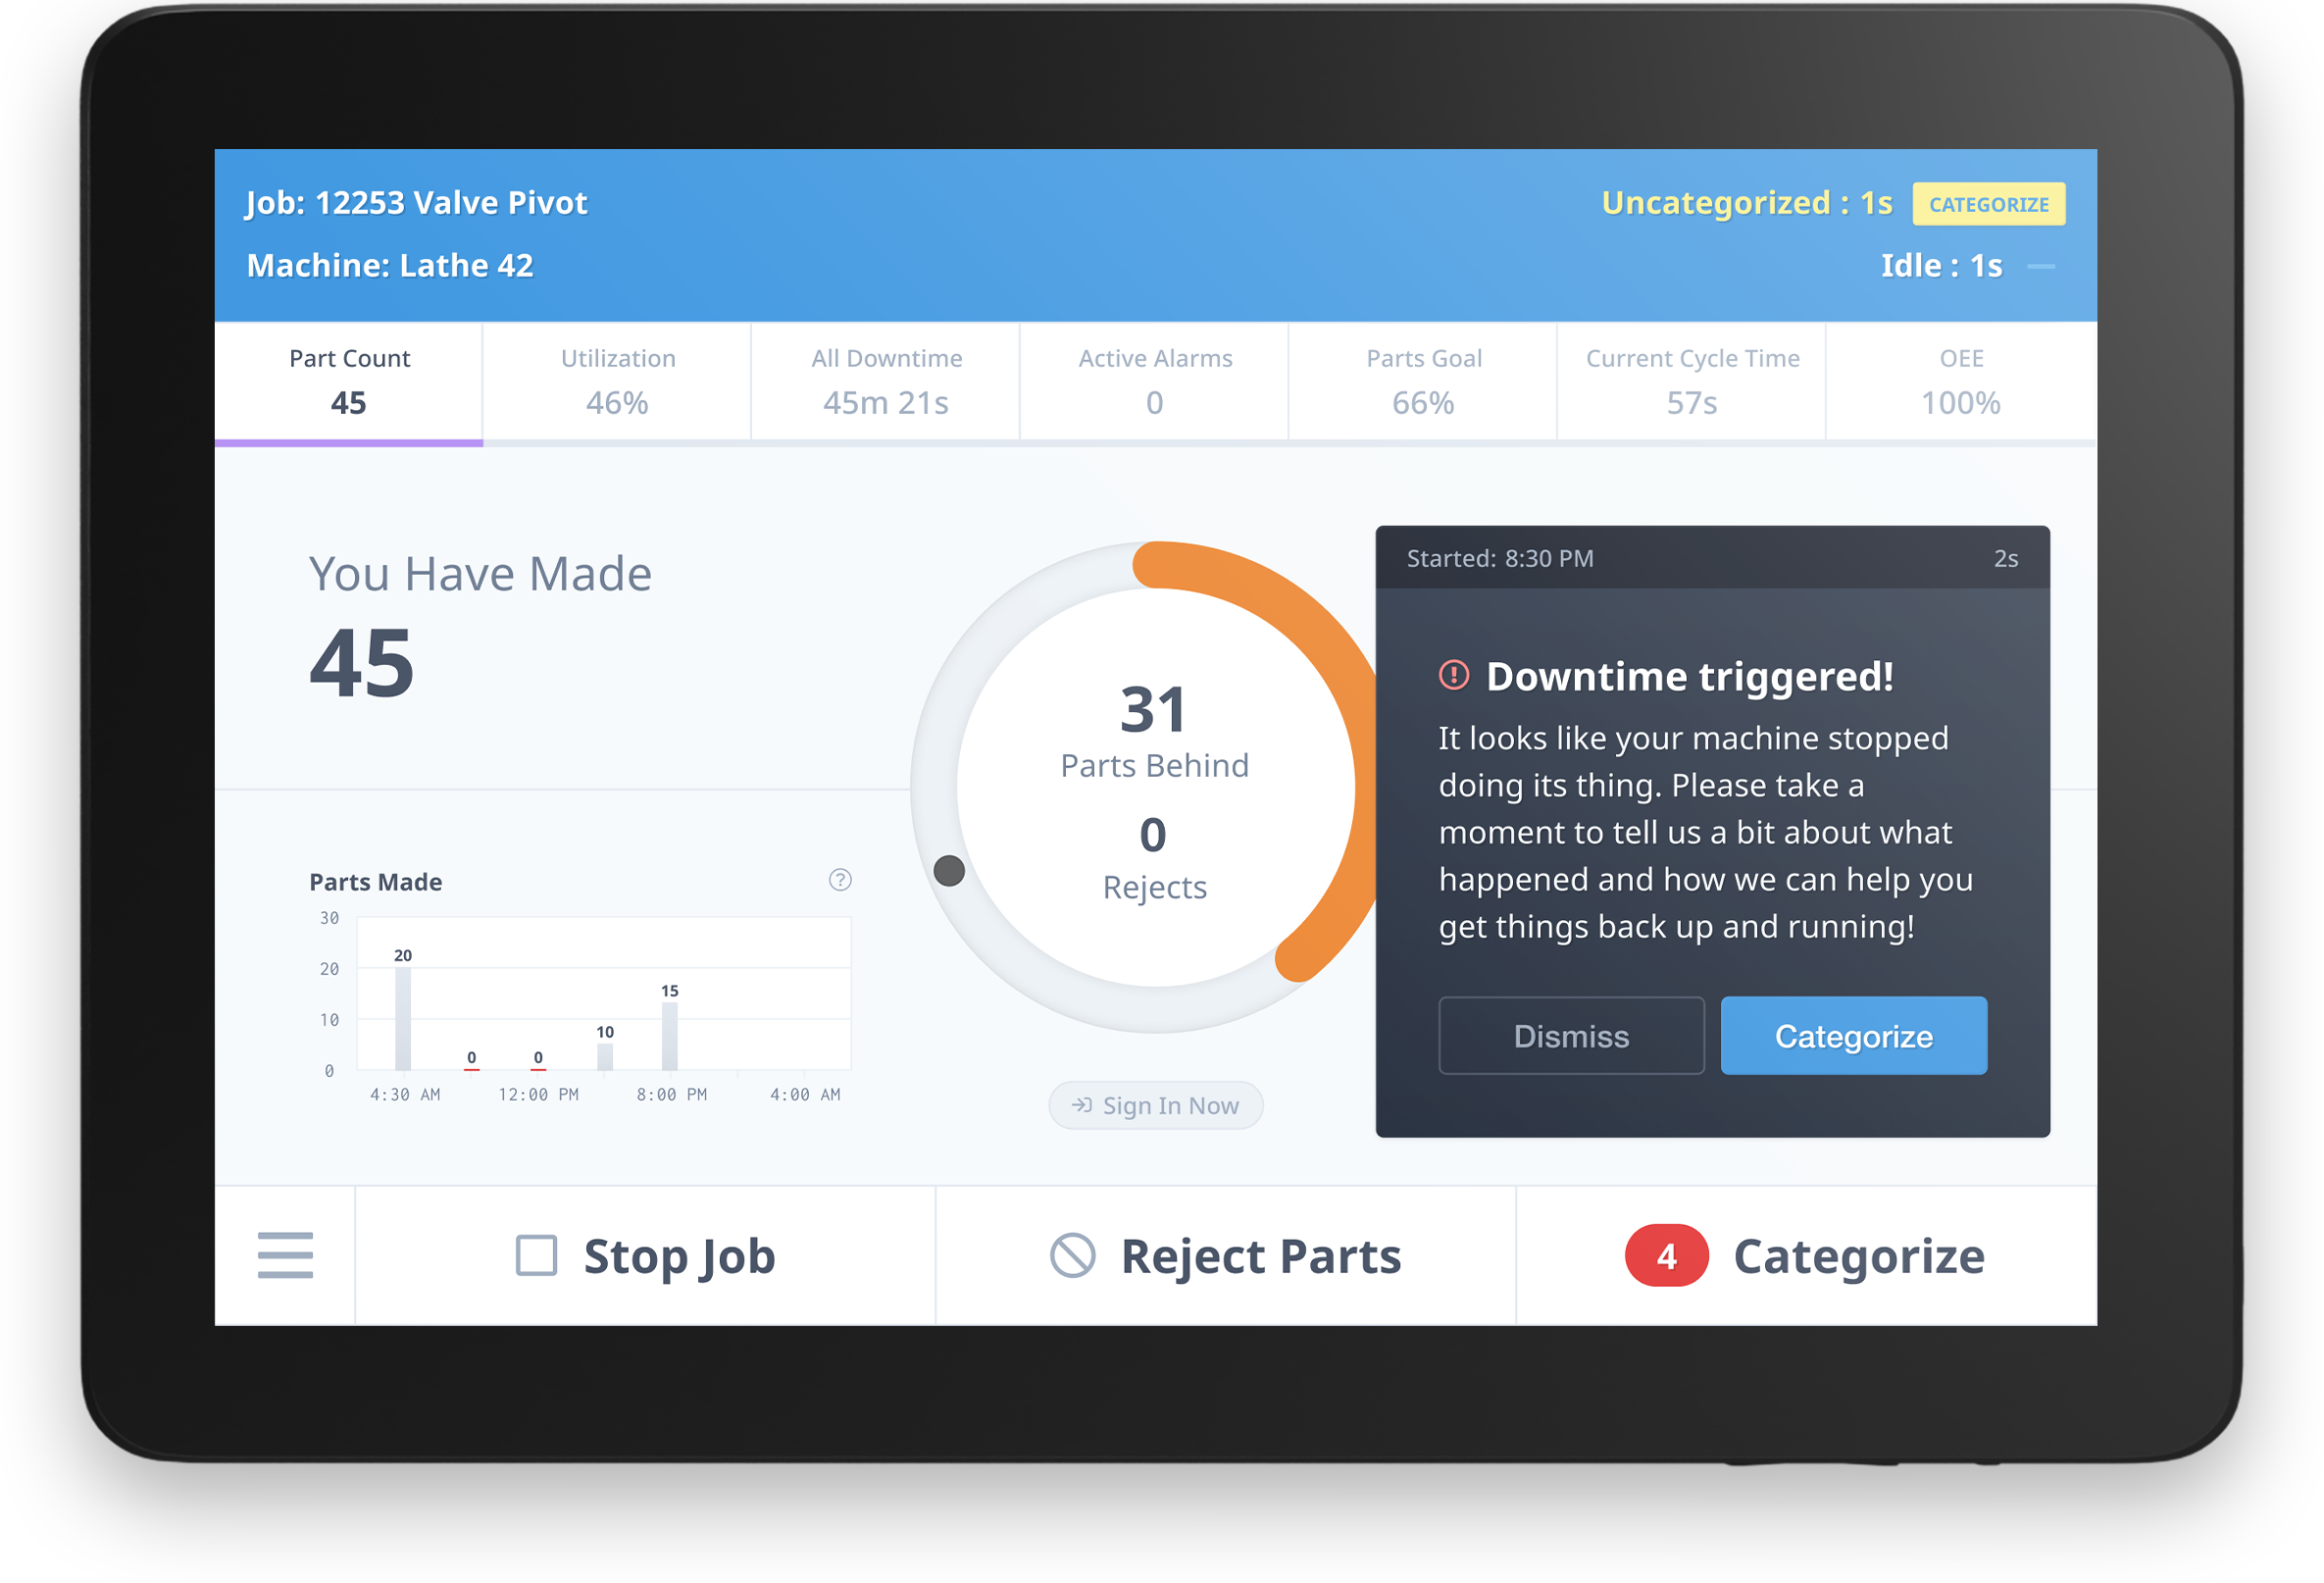
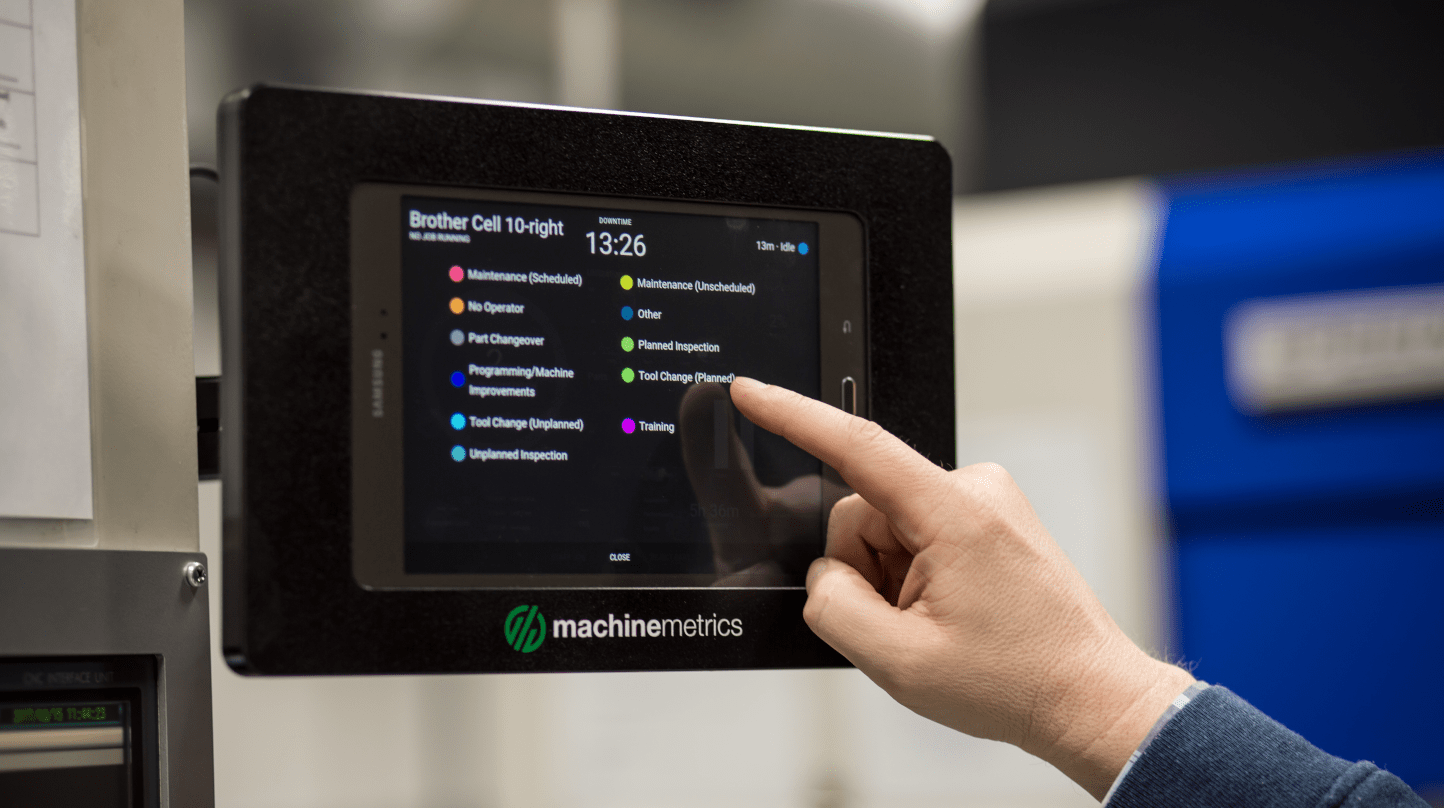
With tablets placed at each machine, operators can document the reason for a given downtime. This contextual data is helpful for not only conducting a downtime analysis but also for enabling workflows and notifications.
On the other hand, alarms are native codes that come directly off the control of some machines and represent a specific issue or condition that the machine is experiencing, like a coolant pump alarm or an alarm signaling that the splash guard is open.

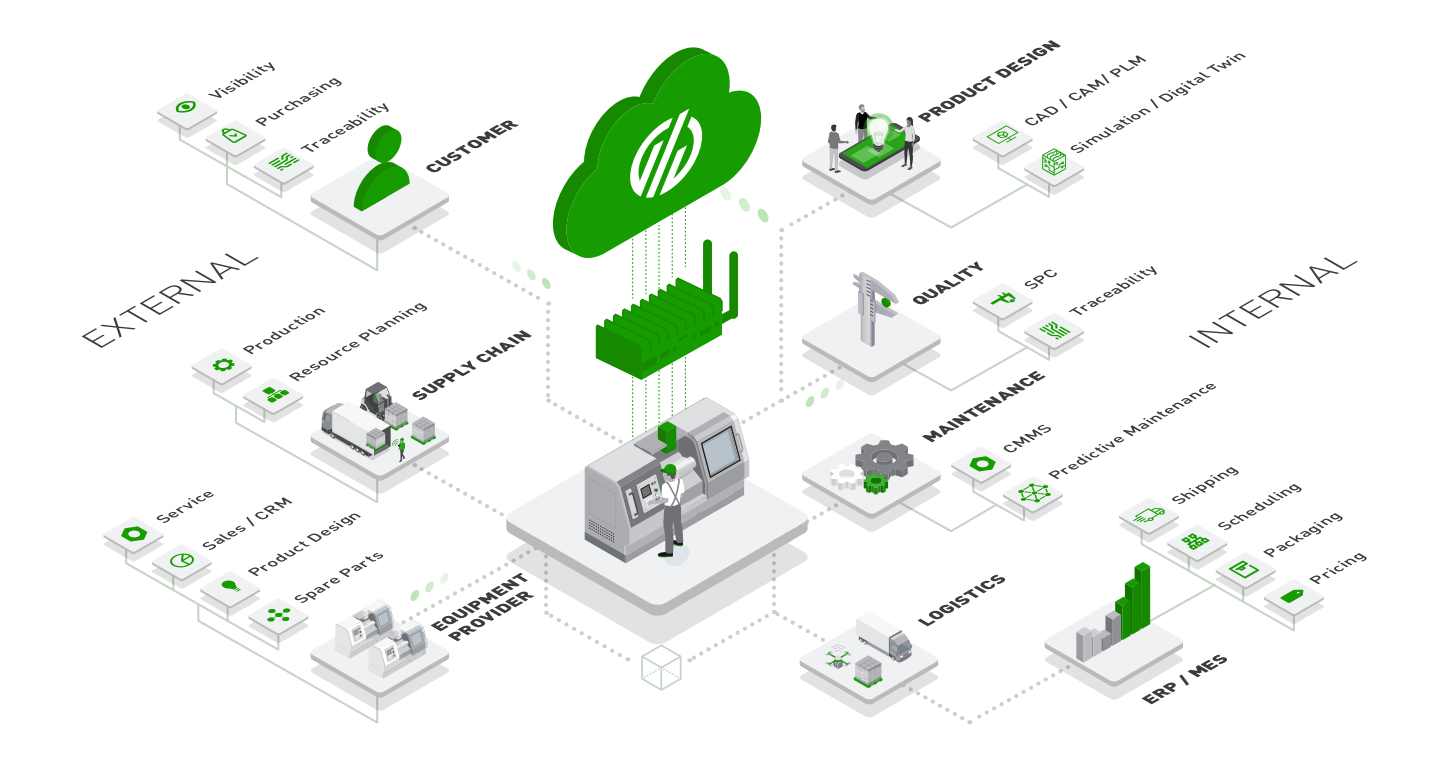
MachineMetrics users can take advantage of both downtime categorization and machine alarms to enable workflows and notifications so that the right information is communicated to the right person when a problem occurs.
All a user has to do is select a trigger (a specific machine alarm or downtime reason) and then an action. The action could be a number of items, including notifying someone of the downtime, relaying the data to a different system such as a CMMS, or simply documenting the incident in the MachineMetrics application.
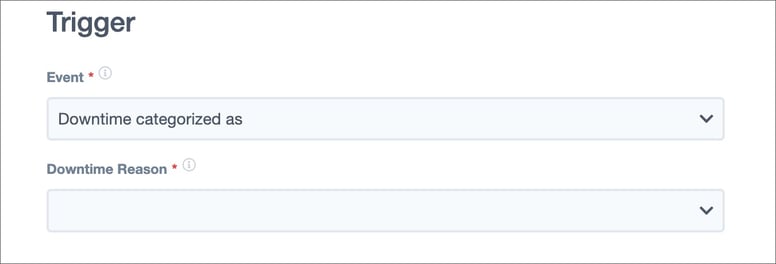
Examples of MachineMetrics in Action
Let’s walk through a few examples of how a manufacturer might use MachineMetrics to resolve machine downtimes quickly.
Escalating Downtime Notifications
For some machine problems, it may not be necessary to respond immediately. In this case, we may introduce a delayed notification that slowly escalates. For example, a coolant pump alarm code may notify your maintenance team after 5 minutes via a workflow. If the alarm is still going after 30 minutes, a notification may then be sent to a plant manager.
Leveraging other Management Systems
Let’s say your management team uses a calendar-based maintenance strategy, and they manage all activity in a CMMS. With MachineMetrics, you could integrate with the CMMS to ensure that the maintenance team uses machine data to drive their activities. For example, you could trigger workflows based on alarms. The action of this workflow would be a webhook that creates a work order in the CMMS. Now the maintenance team can operate based on machine performance rather than over-maintenance equipment via a calendar-based strategy.
Measuring the Impact
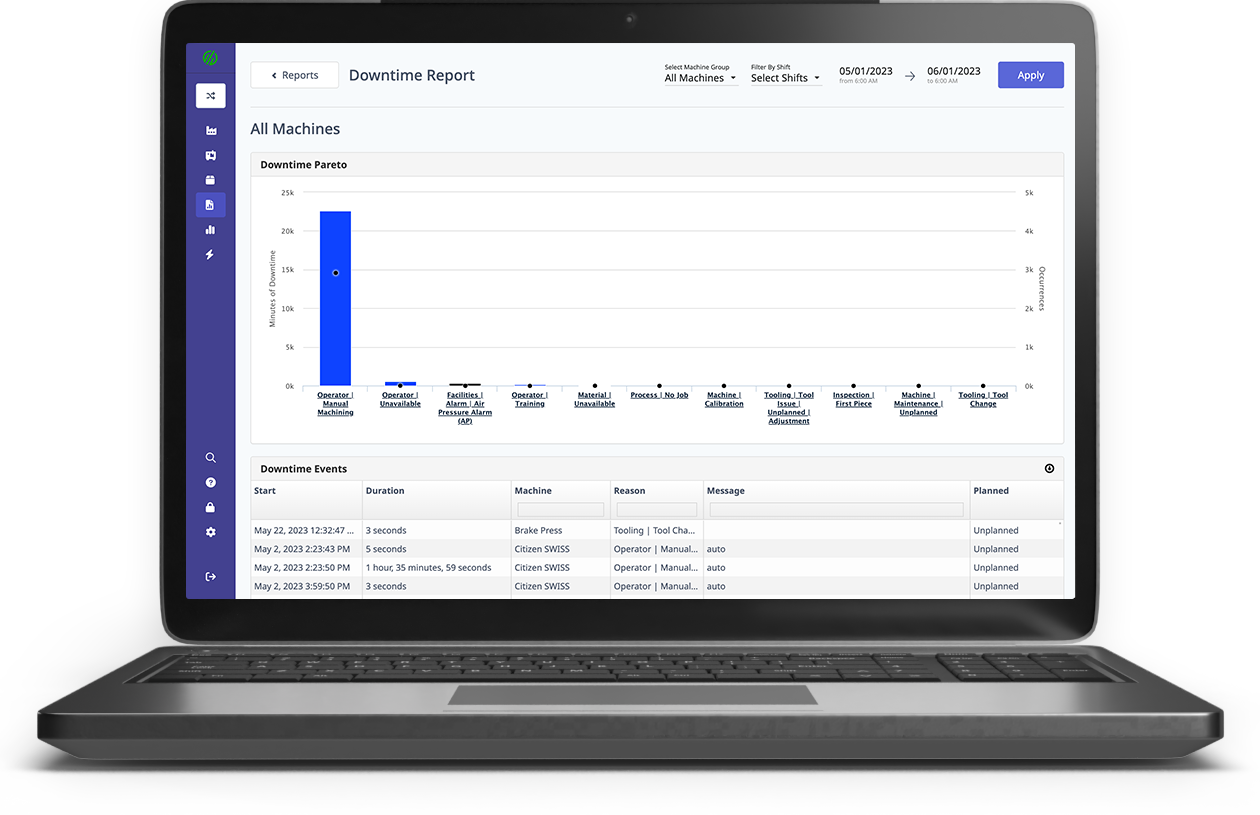
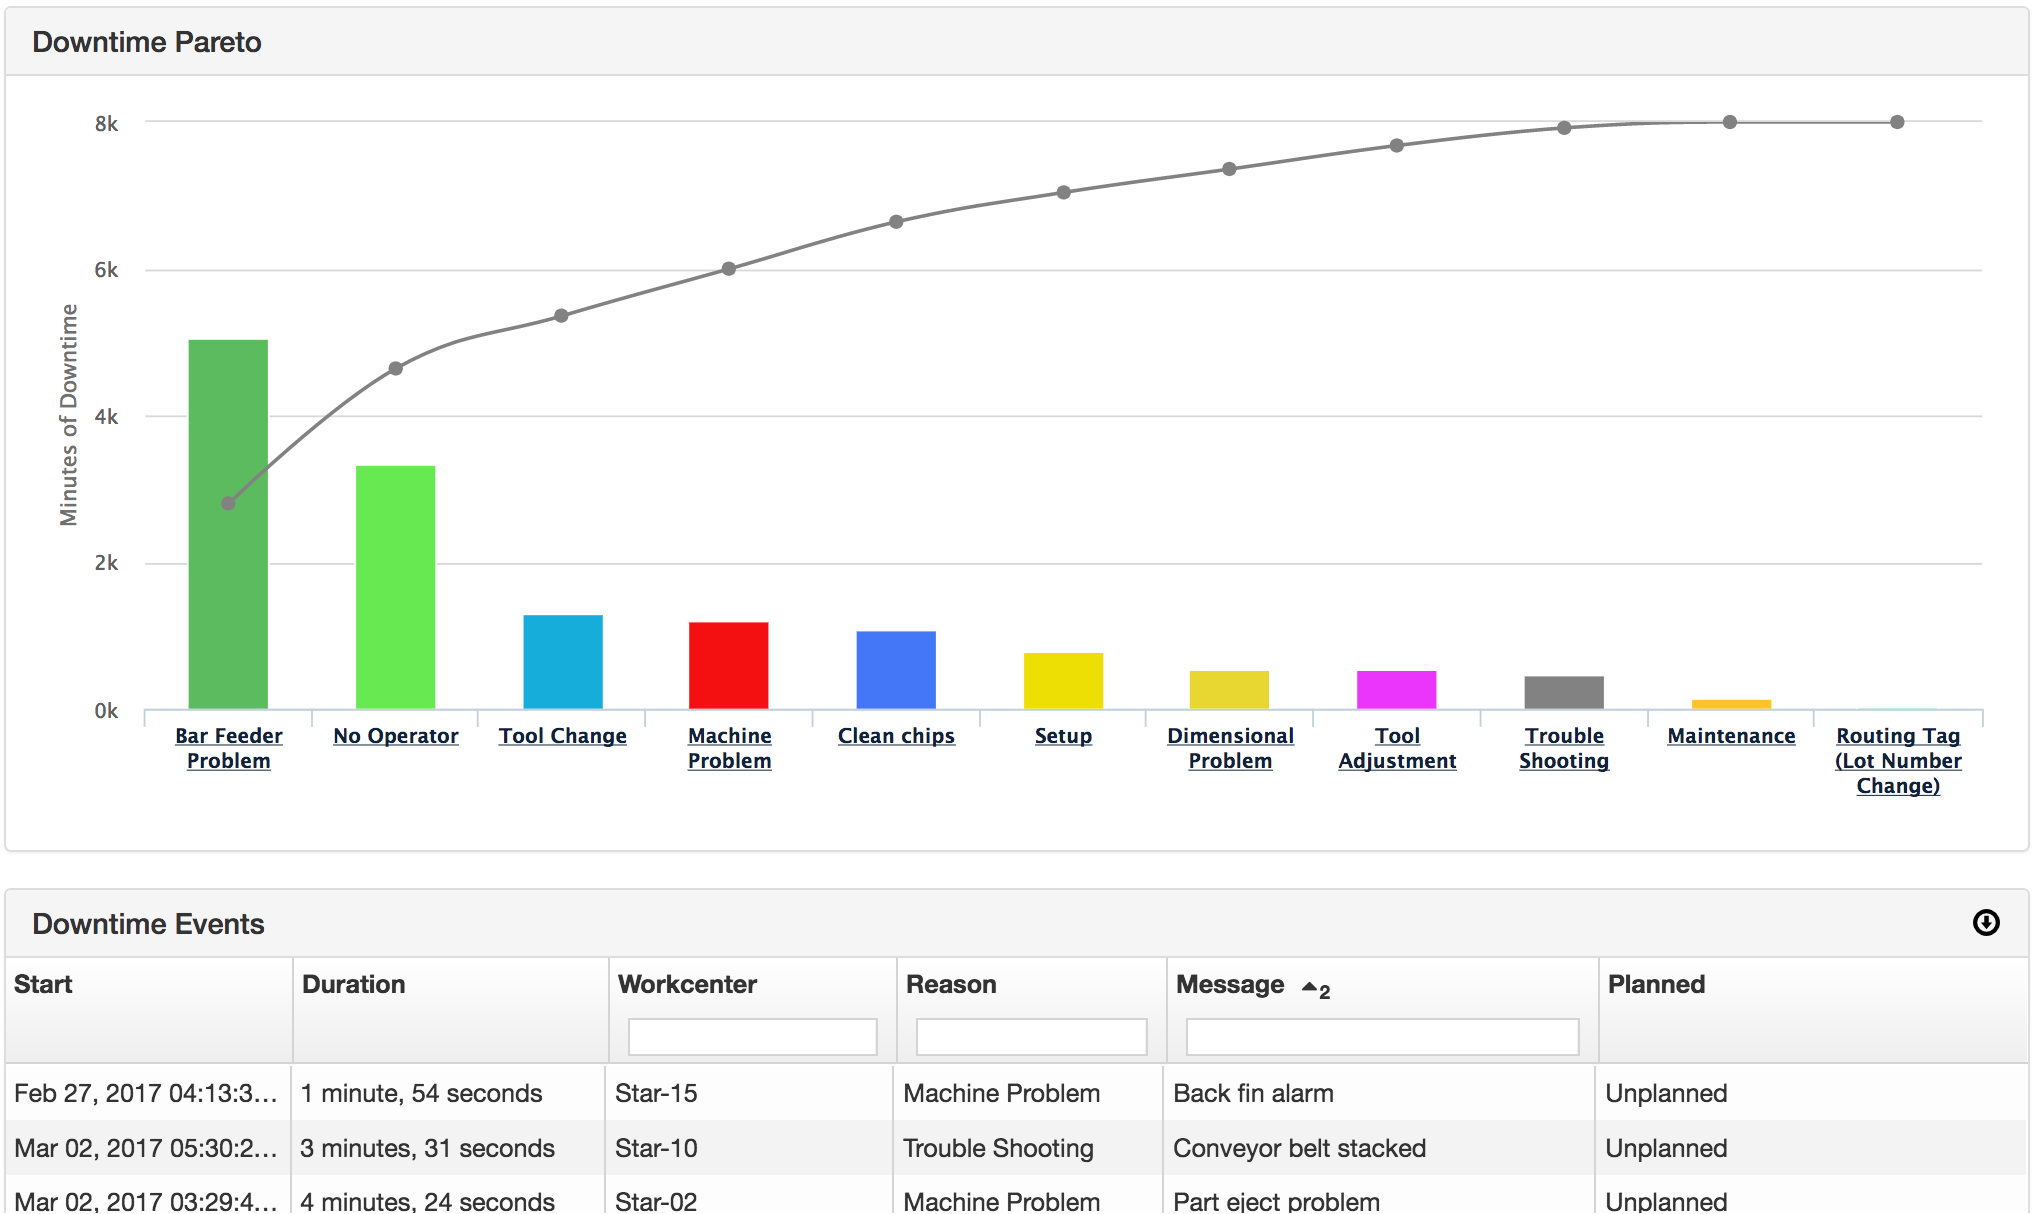
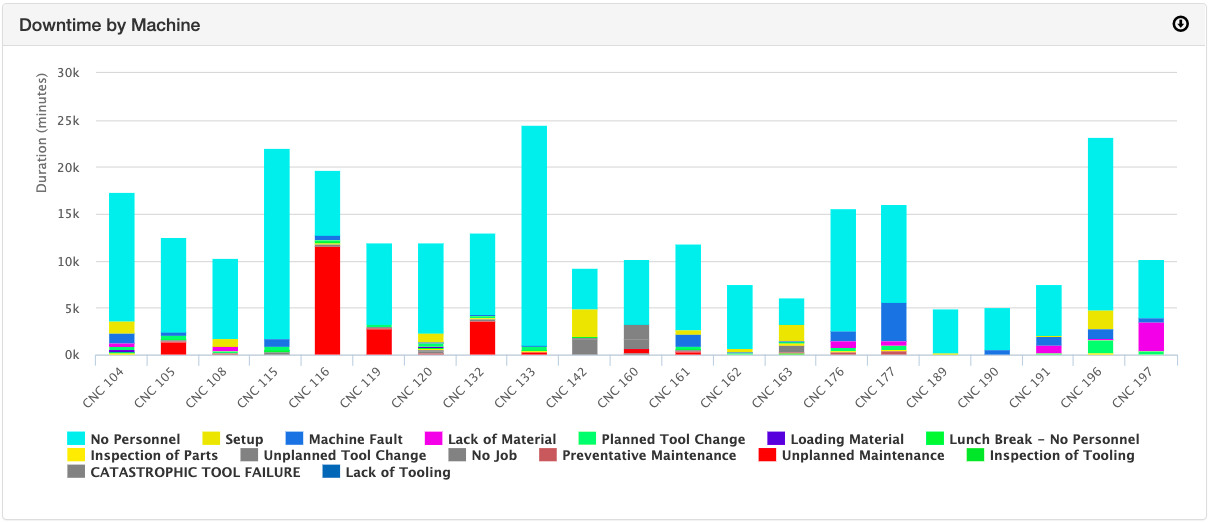
In the below video, Customer Success Manager Josh Fish walks through many of the MachineMetrics reports you can use to track machine downtime and understand the impact of any changes you have made to resolving downtime and alarms faster.
Plug-and-play Machine Connectivity

.png?width=1960&height=1300&name=01_comp_Downtime-%26-Quality_laptop%20(1).png)

 Not only does this instant visibility help operators and managers identify and respond to


Comments