Key Takeaways:
- Manufacturing analytics enable data-driven decision-making for improved efficiency.
- Real-time insights help identify bottlenecks and optimize operations.
- Leveraging analytics drives continuous improvement and competitiveness.
Advanced manufacturing is a difficult and complex endeavor. And as consumer tastes and trends have accelerated the desire for new products and shortened lifecycles of existing products, today’s manufacturers must rely on big data to help them manage, predict, and pursue the right products at the right time. One study by PwC shows that as high as 92% of manufacturers consider their decision-making to be either highly data driven or somewhat data driven.
It’s easy to think of big data as one giant entity to be managed for arriving at the correct insights. But there are different types of data that can be used depending on the maturity level of the company as well as the type of software that managers and stakeholders can deploy to improve decision-making at the enterprise and factory level. We call this the manufacturing analytics journey, and it includes four types of data analytics.

As manufacturers mature in their analytical capabilities, they move from descriptive to prescriptive analytics.
- Descriptive Analytics – Descriptive analytics tells the user what happened. It is a type of data processing that uses historical data from across the factory or company to look for patterns, associations, and relationships. Using data aggregation and data mining, data is organized in a way that can yield deep insights into past actions.
This information can yield value that helps develop product strategies and in ways that help users understand trends over time. It can be applied in broad categories such as quality, finance, and revenue. But descriptive analytics is limited to its backward-looking nature. While useful patterns and trends can emerge that help inform decision-making, it is limited in its application to current and future occurrences. For companies that are highly data-driven, additional types of data analytics are used as well.
- Diagnostic Analytics – Where descriptive analytics describes what happened, diagnostic analytics explains why it happened. Armed with the understanding that a machine or product group did behave in a certain way, diagnostic analytics helps determine why. Diagnostic analytics uses techniques such as drill-down, advanced filtering, and data mining to look for correlations to explain the why. This type of analysis is useful in gathering insights into specific problems and developing reliable predictions on how to avoid them.
One example of the value of diagnostics analysis is in determining whether alerts are valid. Because today’s connected factories generate an enormous amount of data gathered from a large array of sensors and edge devices, diagnostic analysis can qualify alerts and categorize them so that human operators can understand them and act. And with the volume of data from a large array of sensors, machine learning can be used to develop models that accurately explain why something happened, which allows for accurate decision-making.
- Predictive Analytics – Predictive analytics are used to explain what is most likely to happen. Using findings gathered from descriptive and diagnostic analytics, predictive analysis is valuable in forecasting. It uses this data to predict data that hasn’t occurred yet. Using statistical modeling, data mining and machine learning, predictive analytics uses a variety of techniques such as:
- Segmentation: Groups based on similarities.
- Association: Identification of the frequency of joint occurrences and creating rules that determine what will occur after a specific set of variables interact.
- Correlation: Identifying relationships between element properties.
- Forecasting: Deriving future values and occurrences.
- Prescriptive Analytics – Using the analysis from the other three types, prescriptive analytics uses machine learning, advanced algorithms, and defined business rules to prescribe what action will be taken. Further, prescriptive analytics can show the likely outcome of that action as well. This empowers decision-makers with a level of accuracy as well as a range of options to determine more than one possible outcome based on the goals of the enterprise. The future of manufacturing, where decisions are not just made but systems are adapted automatically based on these decisions, is driven by prescriptive analytics.
Data is what makes MachineMetrics so good at what we do. And at MachineMetrics, the goal of data is to empower a wide range of machine learning algorithms and deep analytics to build a real-time, actionable platform to drive value through OEE and manufacturing efficiency gains. Combined with customized dashboards that allow visualization through fixed HMIs as well as portable devices, decisions can be made based on the power of these analytics to empower operators and drive efficiency.
An in-depth resource on the practice of collecting and using analytics to drive greater efficiency on the shop floor
Using Analytics in a Connected Manufacturing Environment
Decision-making strategy changes as an enterprise matures. And the type of analytics used changes as well. For companies that are not highly data driven, 79% of the focus of their analytics consists of only descriptive and diagnostic. At the other end of the spectrum are highly data-driven companies where predictive and prescriptive analytics make up 54% of its analytics utilization. MachineMetrics helps its customers realize the benefits of deep analytics and helps to apply them uniquely to their operation.
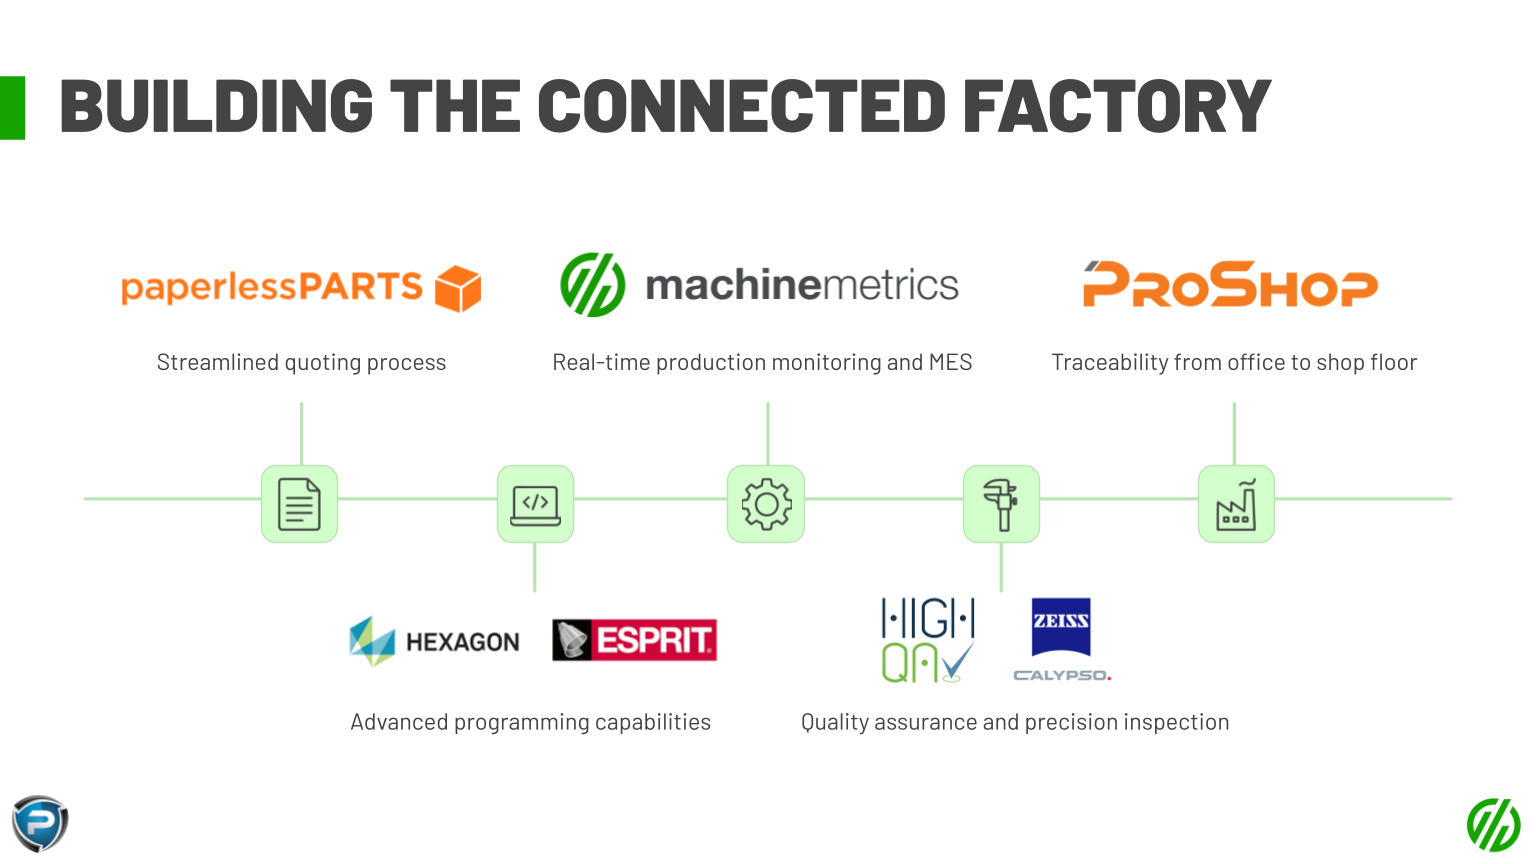
For both the “somewhat data-driven” and “highly data-driven” organizations, the arrival of the Industrial IoT means that those using advanced manufacturing technology can utilize devices and software to focus on the right combination of analytics for the best results. Industrial IoT technology and software provides a level of interoperability among different equipment types to standardize data for use within analytical software. Customers at MachineMetrics have experienced this and have used it to integrate with other solutions such as ERP systems, scheduling and planning tools, and OEE software.
Without the use of sensors and edge devices deployed on equipment, the collection of vast amounts of data would not be possible. Through MachineMetrics, customers are able to utilize this data in real-time, allowing for the most accurate iteration of the data within the analytics programs. And with deployed sensors and edge devices, latency can be eliminated, creating as close to instantaneous information as possible.
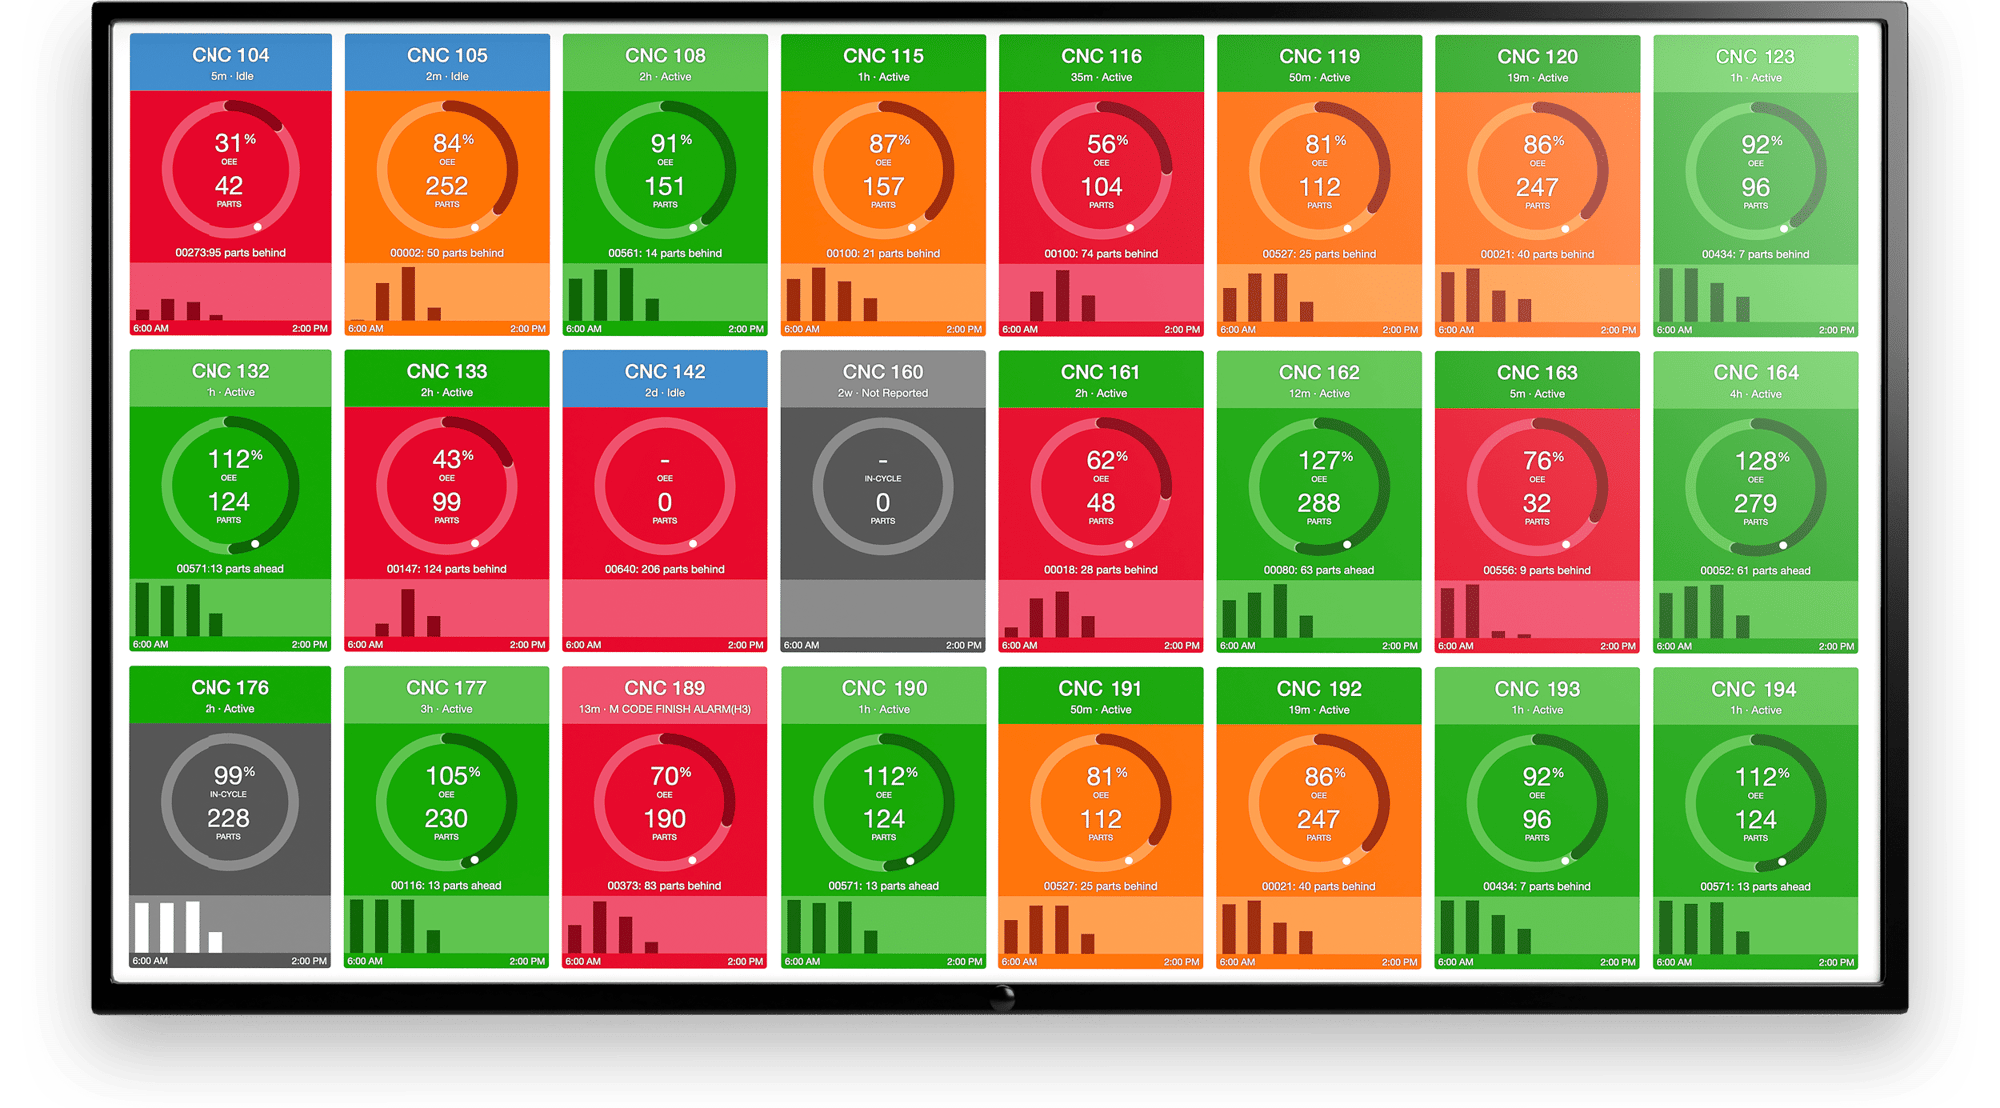
Given the vast amounts of data collected with IIoT devices, raw data means little without the analytics. The reason for this is that humans could not process the data into meaningful decisions. However, beyond the type of analytics utilized is the ability to visualize the results to make those decisions. Today’s IIoT technology delivers the ability to move the analytical results into visualized formats. Interactive dashboards, customized screens and optimized handheld devices such as tablets and phones allow operators, technicians, and managers to see a visual representation of their machines and plant floors.
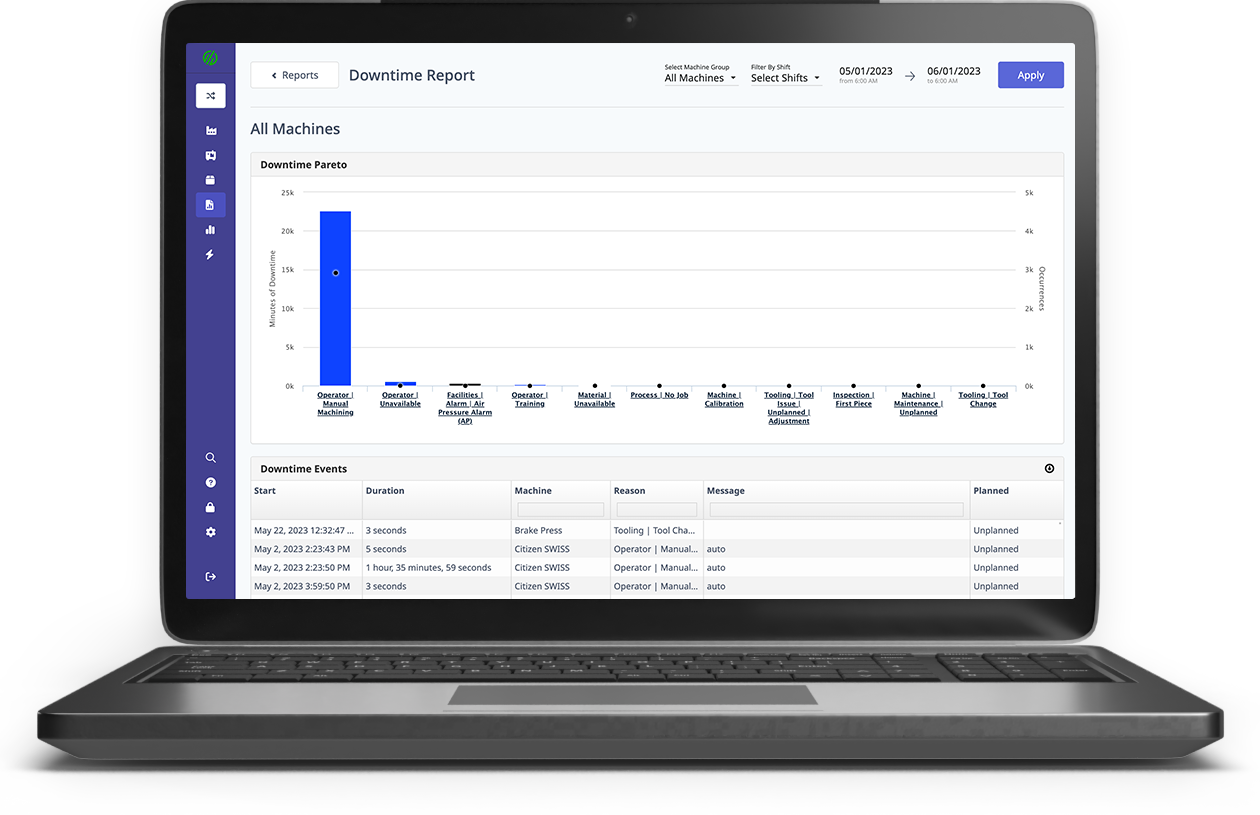
Collection of data allows for accurate asset monitoring, real-time condition monitoring, real-time production statistics, and utilization reporting. It can deliver these visually with customized operator dashboards and appropriate notifications and alerts. This allows for accurate monitoring of downtime and quality performance as well as for actionable areas for setup and changeover. Going further, data analytics helps to drive greater insight into the data being collected, which can help to identify trends, pinpoint cause and effect relationships, explain production bottlenecks, and even launch predictive maintenance programs.
Using the above types of data analytics, manufacturers can integrate with existing company software to improve their performance while delivering real-time information to drive optimized decision-making across the enterprise, from the factory floor to the corporate office.
.png?width=1960&height=1300&name=01_comp_Downtime-%26-Quality_laptop%20(1).png)


.gif)



Comments