
Book a Demo of MachineMetrics
The leading platform to collect, monitor, analyze, and drive action with machine data. Set up time with a product specialist to learn how we can help your operation.
Ready to empower your shop floor?
Learn More.svg)

As we round out Week 12 of quarantine, many of us are wondering — when will this be over? It’s looking more and more like the effects of coronavirus are here with us to stay, until an effective vaccine can be manufactured en-masse. As universities and labs continue to publish research on this new virus, it’s becoming increasingly clear to us that even though most cases are mild, the spread and severity of a novel contagion on the human population is still severe enough to make it a once-in-a-century crisis. Back during the Spanish Flu of 1918, as now, policy makers struggled to toe the line between public health and economic stability.
However, there are two big differences between now and then. The first is obvious — modern standards for medical care far outpace where they were a hundred years ago. The second, which is less obvious, but equally as important, is that we have more widespread and robust data collection methods. In just our industry - manufacturing - there has been an explosion of ways to get data of all sorts into the hands of decision makers.
We are entering a new paradigm of existence, one which is dictated by rapid shifts in both economic and health conditions; viruses operate in the realm of exponential growth, a concept which is hard for us to fully grasp. It is often confusing to try to assess the true impacts of exponential phenomenon with our natural instincts.
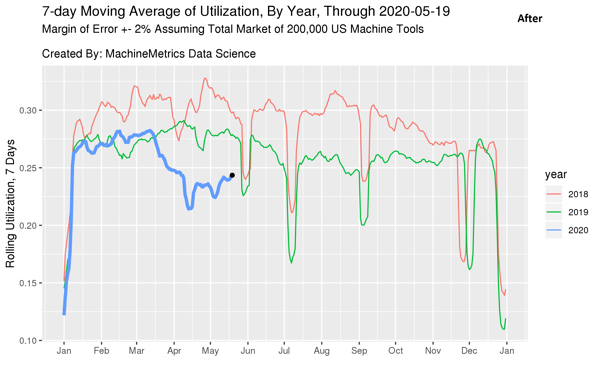
As such, data must be our friend and guiding force. Live, real-time updates on information and benchmarks become ever more important. Just like keeping an accurate pulse on case growth will be instrumental to balancing health and economic policy, keeping tabs on factory utilization will be key to assessing the state of our industry - the industry which will manufacture the necessary goods to help our world recover, stabilize, and continue to thrive in the future.
We at MachineMetrics are in a fortunate position to provide information to industry, policy experts, and consulting firms to allow a more accurate evaluation of the state of the industry. In just these last few weeks, we have been honored to be contacted by many organizations looking to incorporate our information into their forecasts and industry assessments. Because of this, we are continually improving our methodology and looking for ways to provide even more rigor behind our analyses. Recently, we have made several changes to our calculations and tweaked a few of our assumptions. These changes do not affect the overall conclusions or direction of utilization, but we feel it is important to be transparent around any changes we make.
On May 21st, we revised some assumptions in our data set:
The aggregate effect of our changes is below. Our margin of error at 95% confidence, with the newly included machines, has changed from 2.24% to 2.08%.
As we emerge from shutdowns, it's important to keep in mind the power of data in enabling an accurate gauge of the state of our industry. We are just beginning to see the inklings of a steady, sustained uptick in utilization, a sign that manufacturing is returning again to a healthy cadence. We will continue to monitor and provide daily updates to all those who are interested.
 The importance of using data cannot be understated when fighting an invisible foe — it must be an essential part of our arsenal, as it equips us with the necessary tools to respond with agility.
We wish you well in these times, and please don’t hesitate to reach out with any questions.
Ready to empower your shop floor?
Learn More

.png?width=1960&height=1300&name=01_comp_Downtime-%26-Quality_laptop%20(1).png)
.gif)


Comments