Updated July 1, 2022
What is Overall Equipment Effectiveness (OEE)?
Overall equipment effectiveness (OEE) provides a means to measure the percentage of productive planned manufacturing time. By measuring OEE, you gain insight into optimal productivity challenges and how to improve your manufacturing operations.
How is OEE Used?
Overall equipment effectiveness is the most widely used standard for measuring manufacturing productivity. This is because it measures the extent to which a manufacturing operation is utilized by comparing current usage measurements to measurements taken when the operation was run at its optimal capacity. OEE can also be applied to measuring the performance of individual machines on the shop floor.
In situations where the benchmark data for a manufacturing facility are unavailable, an OEE calculation can be compared to available industry standards or to the data collected from similar shop floors using the same equipment.
Overall equipment effectiveness combines machine or equipment data and multiple operational issues affecting production to calculate OEE percentages or scores. Three critical metrics defining every manufacturing process are required to calculate OEE.
Important OEE Metrics
- Availability – The availability of production equipment is critical to the success of a manufacturing operation. Thus, availability refers to the percentage of scheduled time that a machine is available to handle its task. This means it’s data-tracking a machine's uptime, and an availability score of 100% indicates that the machine and production ran continuously according to schedule without experiencing unplanned stops.
- Performance – On the other hand, performance considers the speed at which a manufacturing process is being run. When applied to machines, it considers the speed at which a machine works compared to the optimal speed the machine was designed to achieve. A 100% performance score means the manufacturing process or machine is working at its optimal running capacity.
- Quality – The final metric in the calculation is the quality score. Quality refers to the end product and considers any defects or products that require any form of reworking to meet set standards.
With these metrics in mind, we are calculating the OEE as OEE = Availability x Performance x Quality.
How to Calculate OEE
A simple case study will help put the OEE calculation in perspective. In this scenario, the OEE of a CNC machine is calculated. The duration of an optimal shift on the machine is 500 minutes, but the operator is expected to go for a 30-minute lunch. The machine is given oil breaks for 40 minutes, and an operator switch takes 30 minutes to be completed. Aside from these breaks, the machine runs for the remaining duration.

Availability
To calculate availability, the planned downtime must be removed from the optimal running time of the CNC machine. The total downtime = 30 + 30 + 40 = 100 minutes.
This leaves the machine availability at 500 – 100 = 400 minutes. This means the machine ran for 400 minutes against the optimal 500 minutes it’s capable of. Thus, the availability percentage = 80%
Learn more about calculating and improving availability.
Performance
The CNC machine is capable of producing five-tool bits every minute. This means within the availability period of 400 minutes; the machine should produce = 400 x 5 = 2,000 tool bits. Here, 2000 bits is the optimal production capacity for each machine running at 100%. But due to the operator in charge, the production cycle was slowed-down, and it took 1.5 minutes to produce five-tool bits.
The additional seconds will slow down production speed by two-thirds using this calculation, 1/1.5 = 0.67. Multiplying this slowed-down rate to the maximum tool bits the machine can produce in the allotted time frame, we get 0.67 x 2,000 = 1340 tool bits. This shows that the machine was running at 66.7% of its optimal capacity, and 33.3% was lost to inefficiencies. Converting that 33.3% to minutes, 400 x 33.3% = 133 minutes.
From the optimal 500-minute running time, 100 minutes were lost to planned downtimes, and a further 133 minutes were lost to a slower operating process. This brings the total running time to 500 -100 -133 = 267 minutes, while the performance is 66.7%.
Quality
In this scenario, 200 tool bits were defective and didn’t meet the customer's required quality, leaving only 1140 functional tool bits for delivery. To calculate the quality score, the usable products will be divided by the 1,340 bits produced (1340-200)/1340 = 0.85 or 85%. This means 85% quality was achieved.
To convert the defective 200 tool bits to time which shows how many minutes were lost making these products, the 200 bits will be divided by the 5 bits which can be made per minute. This gives 200/5 = 40 minutes.
The total minutes lost during the entire manufacturing process consider the planned downtime, the slowed-down process, and the time spent making defective tool bits. This gives 100+133+40 = 273minutes. This also means that the CNC machine ran optimally for (500 – 273) 227 minutes.
Using the OEE calculations you get Availability (80%) Performance (66.7%) Quality (85%) = 45%.
This OEE calculation shows that the overall equipment effectiveness was 45%. The optimal production time achieved was 227 minutes as against 500 minutes, and 1,140 tool bits were manufactured against a possible 2,500. You can also divide the achievable production time by the optimal time or the total tools produced divided by the optimal production capacity to get the OEE.
As you can see, this example considers a single machine working in a day, but this isn't ideal for real-time calculations. The general expectation is to collect operational data from a fleet of machines or equipment performance over a month or two. This provides more than enough data for OEE calculations and to receive actionable insights into optimizing equipment efficiency levels. A machine data platform that collects data round-the-clock from multiple machines and processes them is required to achieve this.
Term Definitions for Overall Equipment Effectiveness
- Fully Productive Time - Fully productive time is ideal for producing first-quality pieces at the quickest pace possible with no planned or unplanned stop time.
- Planned Production Time – The total time a machine or piece of equipment is scheduled to run production.
- Ideal Cycle Time – The shortest cycle time it takes to produce a part in optimal conditions.
- Run Time – The measure (usually in minutes) of total scheduled time minus any unplanned downtime incurred during the run.
- Total Count – The measure of all losses during a run, including stop time losses, speed losses, and quality losses.
- Good Count – Total pieces manufactured without defect or loss of part.
- Good Parts – Parts that travel the entire manufacturing process on the first pass-through without needing rework to bring them in spec.
- Quality – Production parts completed within specifications.
- Performance – The calculation of Ideal Cycle Time multiplied by Total Count and divided by Run-Time.
- Availability – The calculation of Run Time divided by Planned Production Time
How to Reduce Availability Losses
Big Loss #1: Equipment Failures (Unplanned Downtime)
Unplanned downtime is always a problem. It can range from mechanical issues like broken shafts, dull tools, and worn bearings to non-machine-related issues like inaccurate inventory, poor scheduling, and outdated documents.
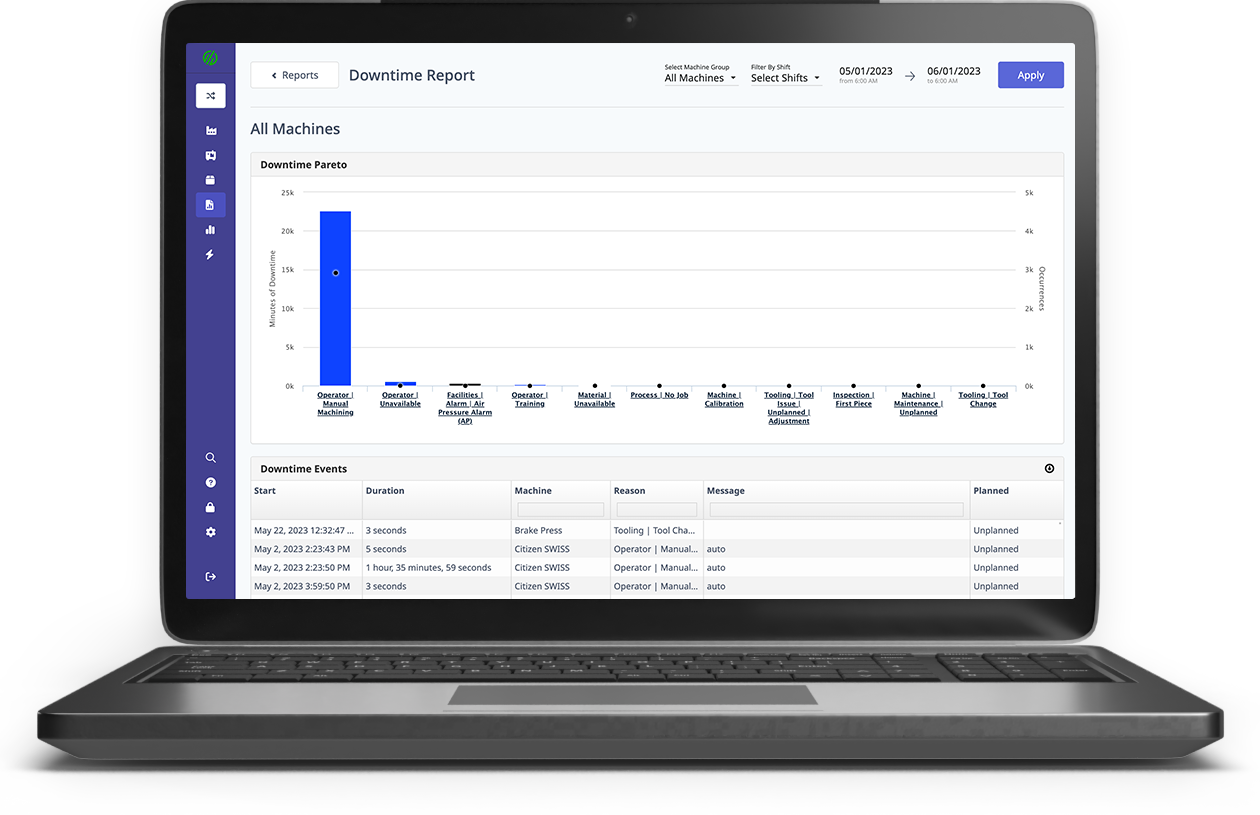
Real-time data can solve most unplanned downtime by using data-driven insights and machine monitoring linked to enterprise systems. Maintenance issues can be addressed through predictive maintenance to head off equipment failure before it happens. Real-time machine monitoring and analysis of what’s happening on the shop floor provides actionable insights to keep planning and inventory sharp.
Big Loss #2: Preparation and Modifications (Planned Downtime)
Planned downtime can also benefit from real-time data. Setup procedures can be audited to enable material and staff to coincide with the end of one run and reduce the time spent during changeovers. Real-time data enables proactive process improvement, reducing modifications and prep time.
How to Reduce Performance Losses
Big Loss #1: Minor Stoppage
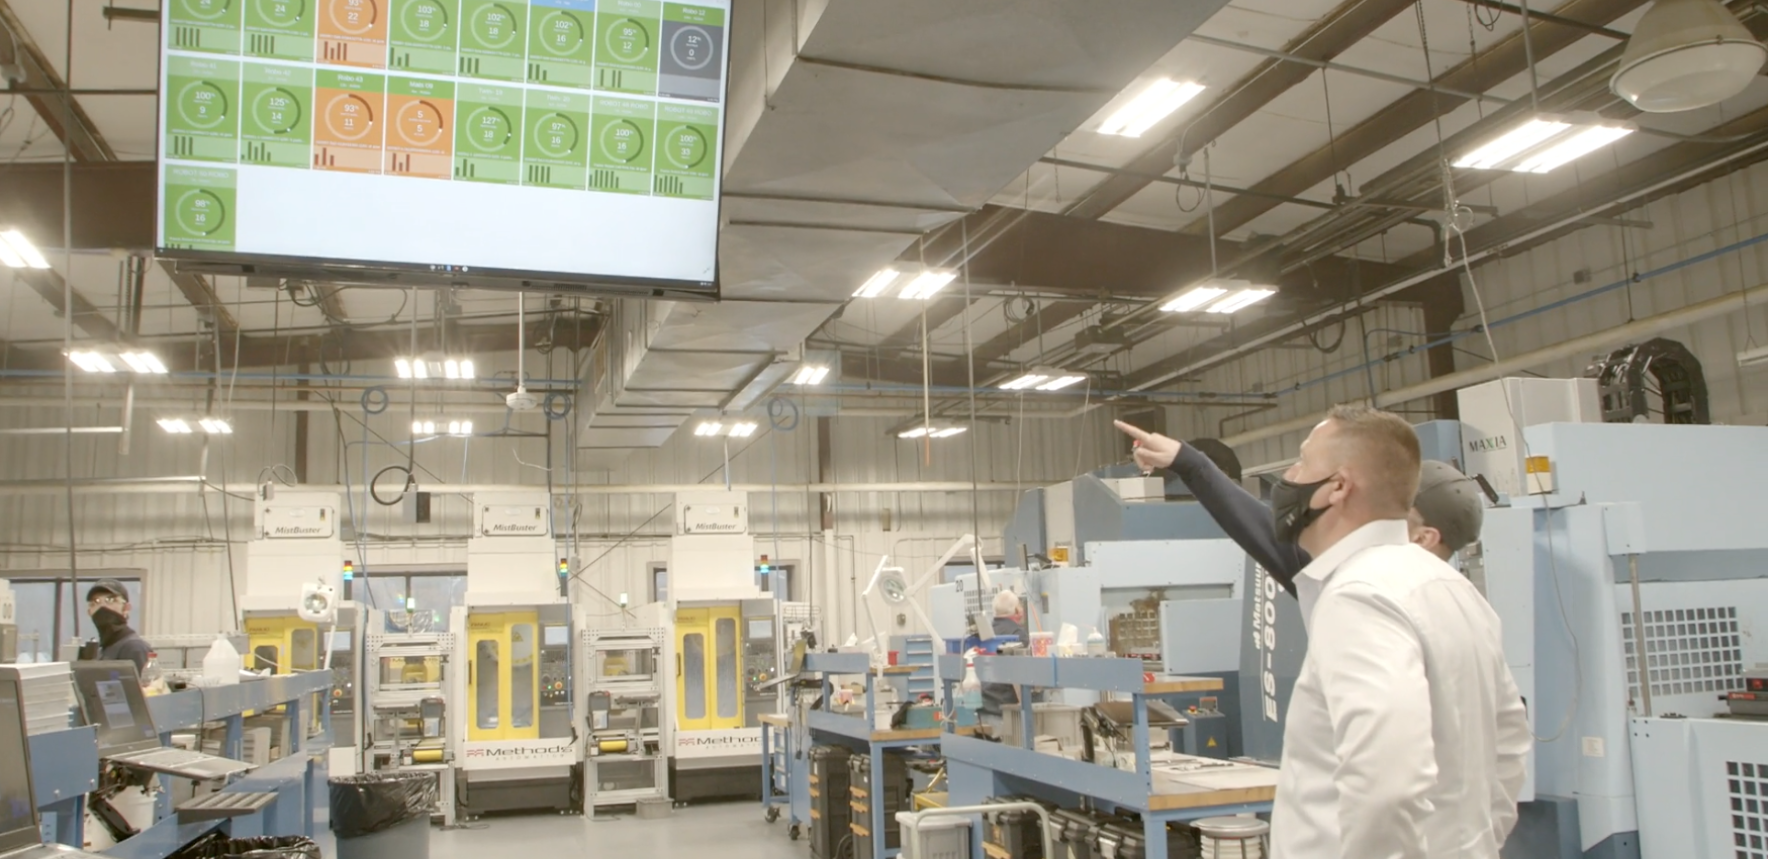
When operators are working with only visual awareness of machines, minor stoppages can take a long time to fix. With real-time data and visualization tools, such as machine conditions displayed on HMIs, operators can see when the material will run out and respond without creating a gap. They can also see other fluctuations and repair them before they become problems.
Big Loss #2: Reduced Speed
Reduced speed may result from debris, slack belts, or any number of conditions. With visualization tools and machine monitoring, operators can see when a spindle or machine component is moving slower than spec and address it before it worsens. This is best accomplished with machine monitoring tools that dynamically display real-time spindle conditions.
How to Reduce Quality Losses
Big Loss #1: Product Scrap
Product scrap may be due to equipment failure, a spindle out of spec, outdated documentation, or other reasons. A machine data platform will enable real-time updates of critical documents like part specifications and workflows. It will also use the same visualization tools for addressing minor stoppages to prevent a part from running so long that it’s no longer salvageable. HMIs and data-driven machine conditions empower operators to act before parts are scrapped.
Big Loss #2: Startup Scrap
Data can be used to analyze startup scrap and empower improvements. Using data-driven insights to change procedures for bringing a part "on spec" means less startup scrap and more available time.
Recommendations for Beginning with OEE
Benchmark Good Production
Benchmark the good production and understand what the operation is doing right. Benchmarking this and comparing it to the available equipment and capacity can paint a clear picture of where to focus on the bad.
Take the Long View
Overall equipment effectiveness isn’t achieved overnight or with a single change; it involves overlapping processes and requires companies to set a strategy for addressing the most critical issues first. As data reveals the biggest culprits and improvements are implemented, the production team can start addressing other issues.
Keep Track of all Variables
Tracking KPIs may be done manually, but using a machine data platform to track them can streamline processes. Tracking KPIs in real-time will help decision-makers understand what variables are affecting KPIs and how to change them.
Common OEE Errors and How to Prevent Them
1. Concentrating on OEE Score Rather than Losses
OEE can deliver a great picture of how equipment is utilized, but that’s only part of the journey. Data should be used to understand why these things are happening and develop process improvements to deal with them.
2. Comparing Unrelated Processes and Plants using OEE
While a manufacturing facility is interconnected, different departments' OEE will vary wildly based on their sub-process. Comparing the OEE of different processes won’t result in knowledge that empowers process improvement. Instead, focus on similar sub-processes and understanding common variables.
3. Excluding Changeovers while Calculating OEE
Changeovers are part of manufacturing. Excluding them from OEE calculations means leaving out the opportunity to improve staging procedures, reduce setup times, and uncover ways to schedule to the strength of common setups.
4. Implementing OEE Throughout the Entire Facility
Similar to comparing different processes, implementing OEE to reveal insights for the entire factory won't work. You'll get a score, but then what? Look at the machine by machine or department by department OEE and develop continuous improvement based on the unique root causes that impact each.
5. An Inadequate Data Collecting Rate
Measuring a single shift or hour isn’t an effective way to understand OEE - it misses many of the things OEE seeks to capture. Use weeks or months to establish a reliable baseline average for performance.
6. Implementing OEE “Your Way”
OEE is a powerful tool for measuring equipment effectiveness. Leaving out critical components, collecting data by hand, or focusing on some calculations over others will lead to misdirected improvement efforts. Instead, embrace the entire OEE toolset and face the difficult problems honestly.
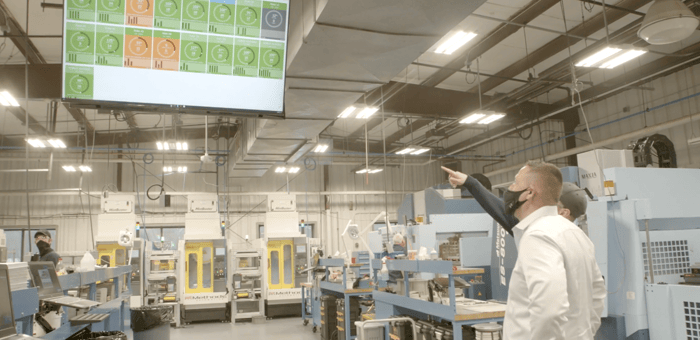
Using Machine Data to Calculate OEE
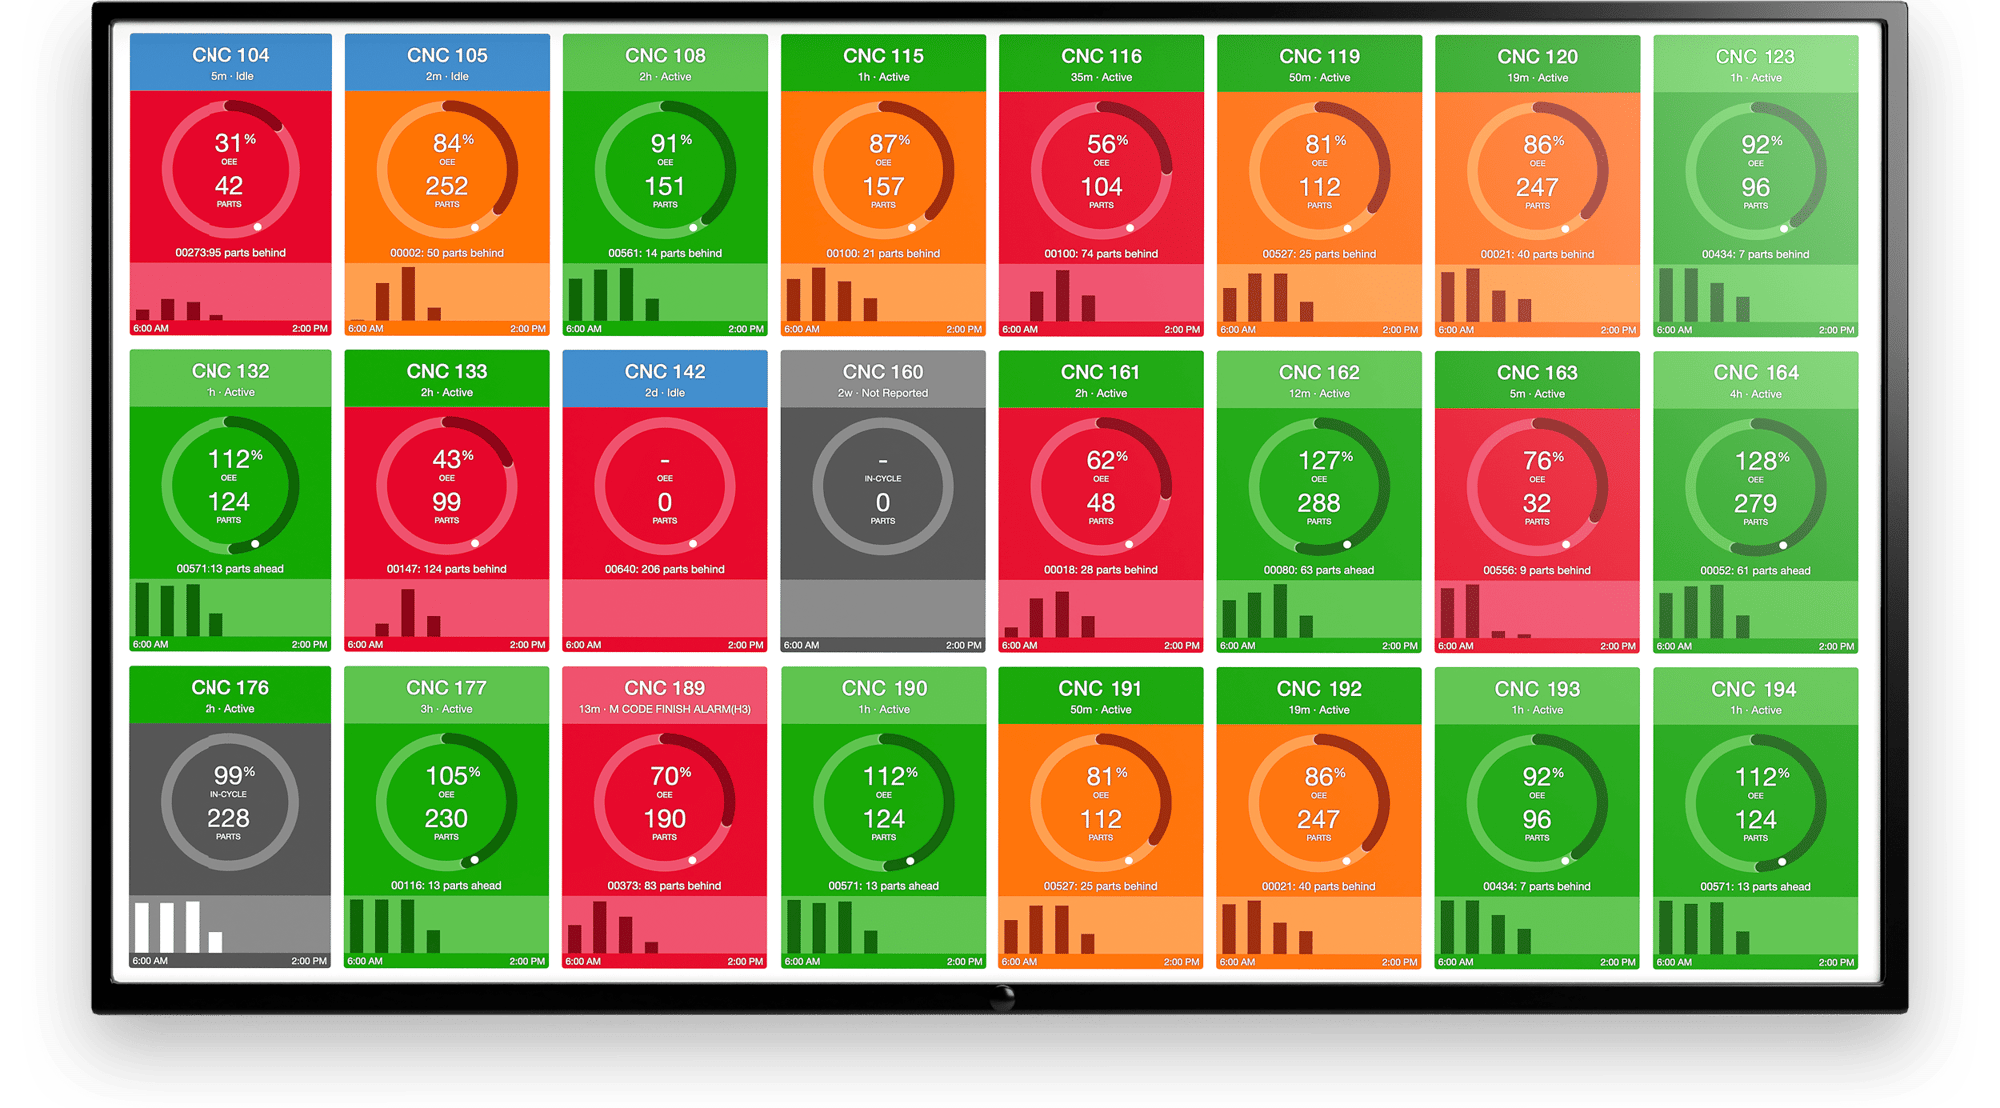
The MachineMetrics Machine Data Platform or OEE software enables manufacturers to calculate their operations OEE accurately.
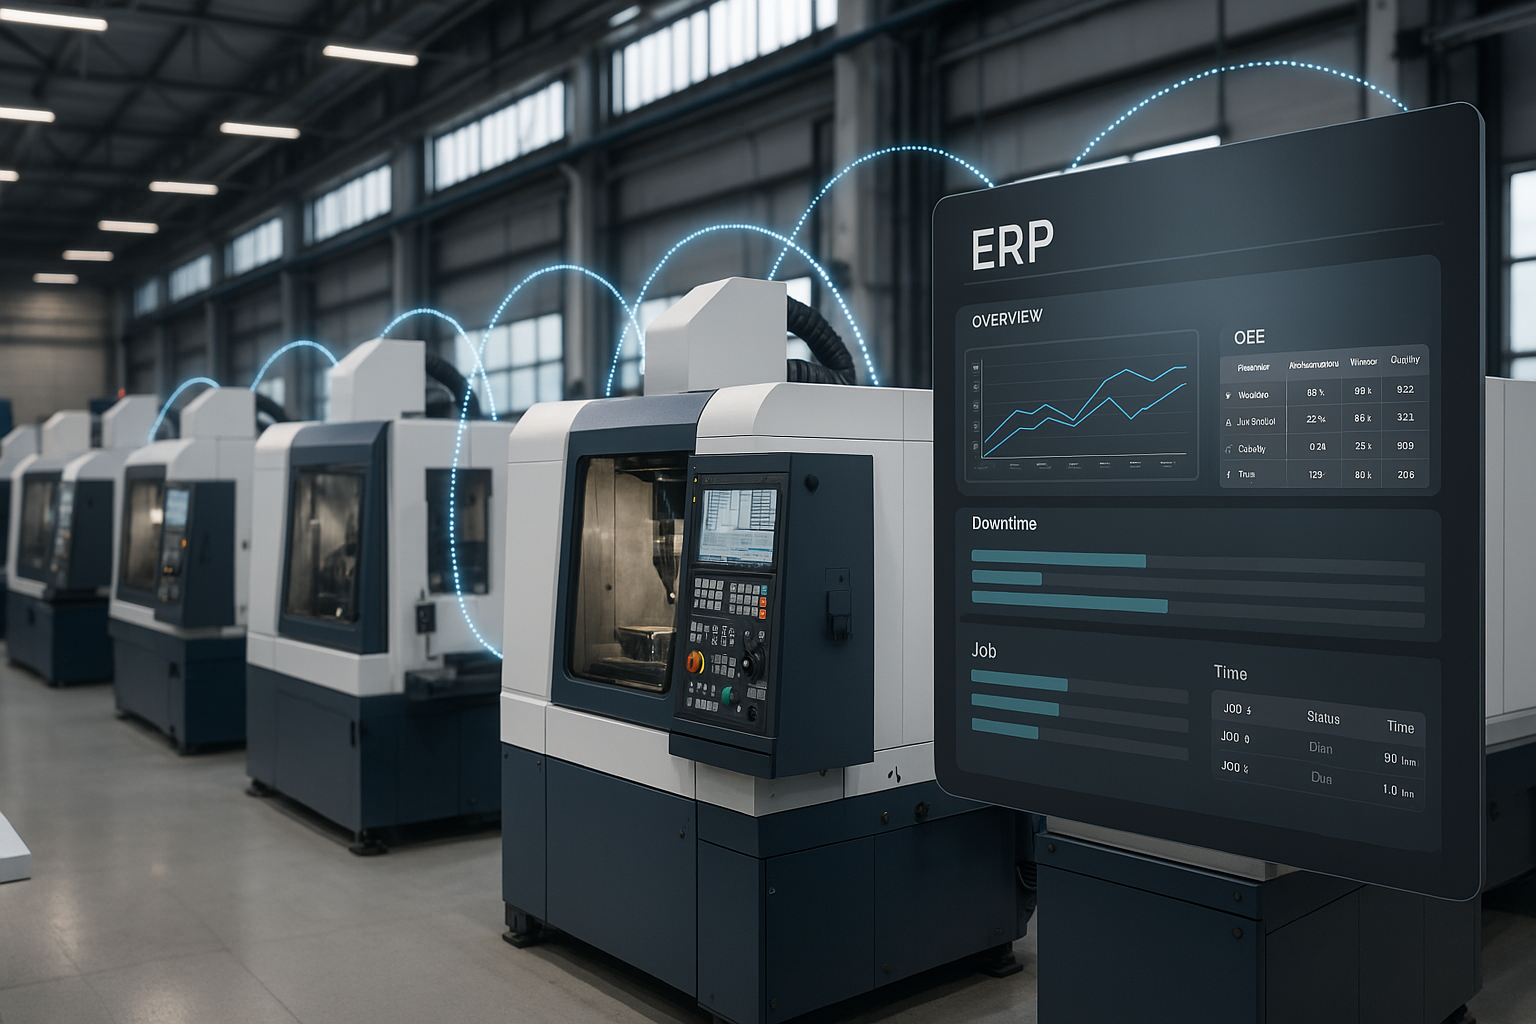
As the case study showed, OEE calculations are dependent on the ability to collect usable data from machines, such as time, output, and operational speed. This is where the MachineMetrics Machine Data Platform comes into play. MachineMetrics offers a plug-and-play solution to capture data from digitized and analog machines. If your target is calculating the OEE of a fleet of manufacturing machines, MachineMetrics will capture the specific data and transform them into standard structures that simplify OEE calculations.
The example of National Oilwell Varco (NOV) is a case study that showcases the use of MachineMetrics in calculating OEE. In this scenario, NOV plugged 60 CNC machines across two facilities into the MachineMetrics platform within two weeks. The MachineMetrics platform captured operational data daily for three months. Access to shop floor data made OEE calculations possible and provided insight into the systematic problems NOV faced. With these insights, the manufacturer could production efficiency and increase operational efficiency by 20%.
To learn more about how MachineMetrics helps optimize manufacturing equipment performance and systems, visit the MachineMetrics Machine Data Platform page.
.png?width=1960&height=1300&name=01_comp_Downtime-%26-Quality_laptop%20(1).png)




Comments