
Book a Demo of MachineMetrics
The leading platform to collect, monitor, analyze, and drive action with machine data. Set up time with a product specialist to learn how we can help your operation.
Ready to empower your shop floor?
Learn More.svg)

As we’ve discussed in previous posts, MachineMetrics collects data from machine controls for the entire production floor and uses this data to monitor machine conditions (faults, status, tool utilization), production (OEE & Machine Utilization), work-order status, quality tracking and downtime reasons. While the machine data we collect tells us when machines are down and any faults that might have led to it, the operators are the only ones that know the full context of the machine downtime.
Fortunately, MachineMetrics allows for operators to add human-context to this data with touchscreen tablet interfaces mounted right at the machine tool. Operators can use these tablets to categorize specific events prompted by MachineMetrics as they are happening with just a few simple taps. This information is then made available in real-time to managers so they can make proactive decisions that drive improvements.
The “Operator View” is displayed on tablets that are magnetically attached to machines using our proprietary mounts. The Operator View is a visualization of one specific machine/workcenter that allows users to see more detailed information than what is displayed in the Current Shift Dashboard overview. Just like the the tiles on the dashboard, the information displayed changes depending on what state the workcenter is in.
This is an example of the Operator View when a machine is in production:
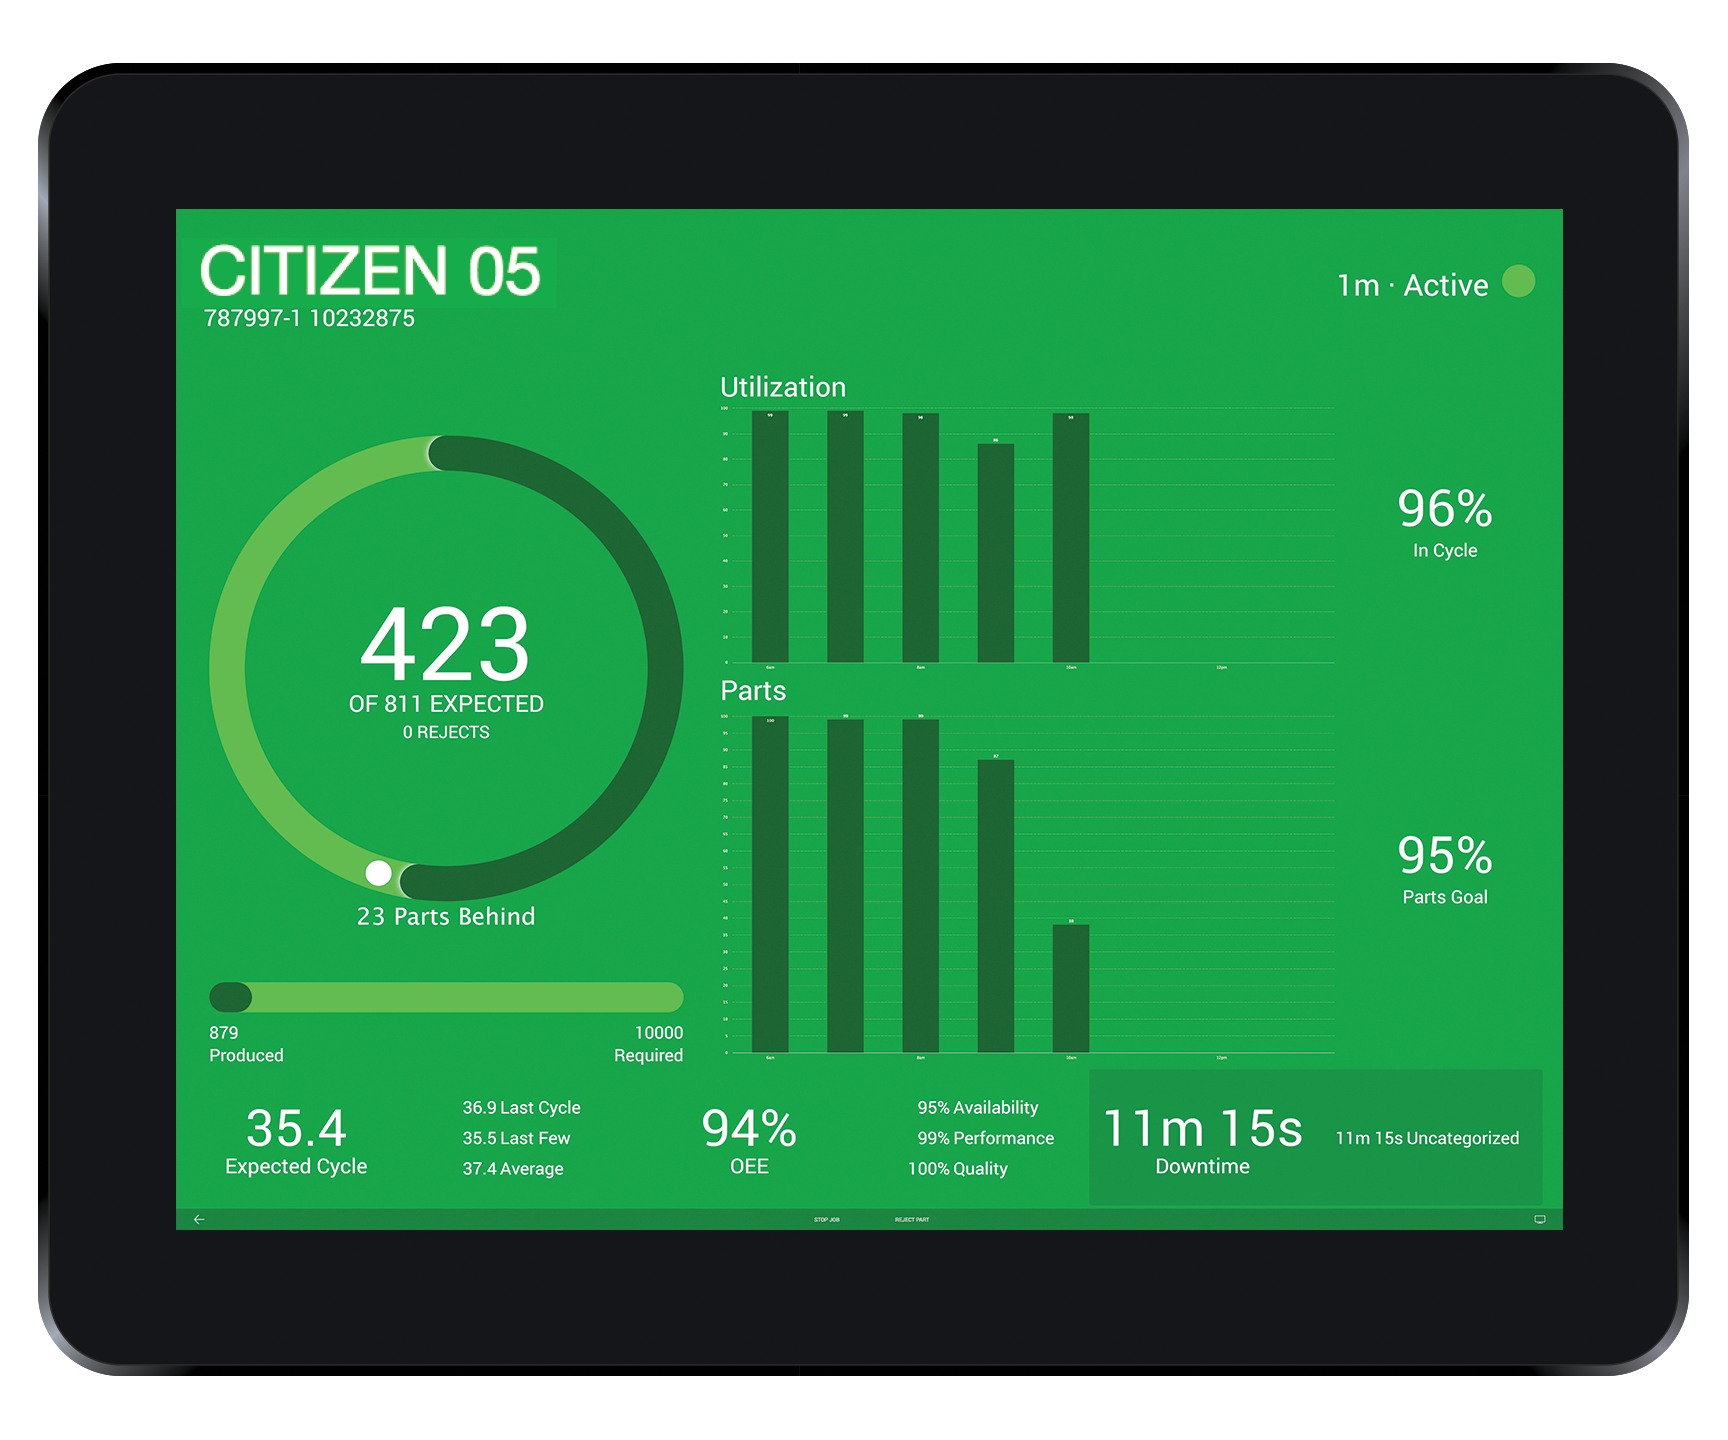
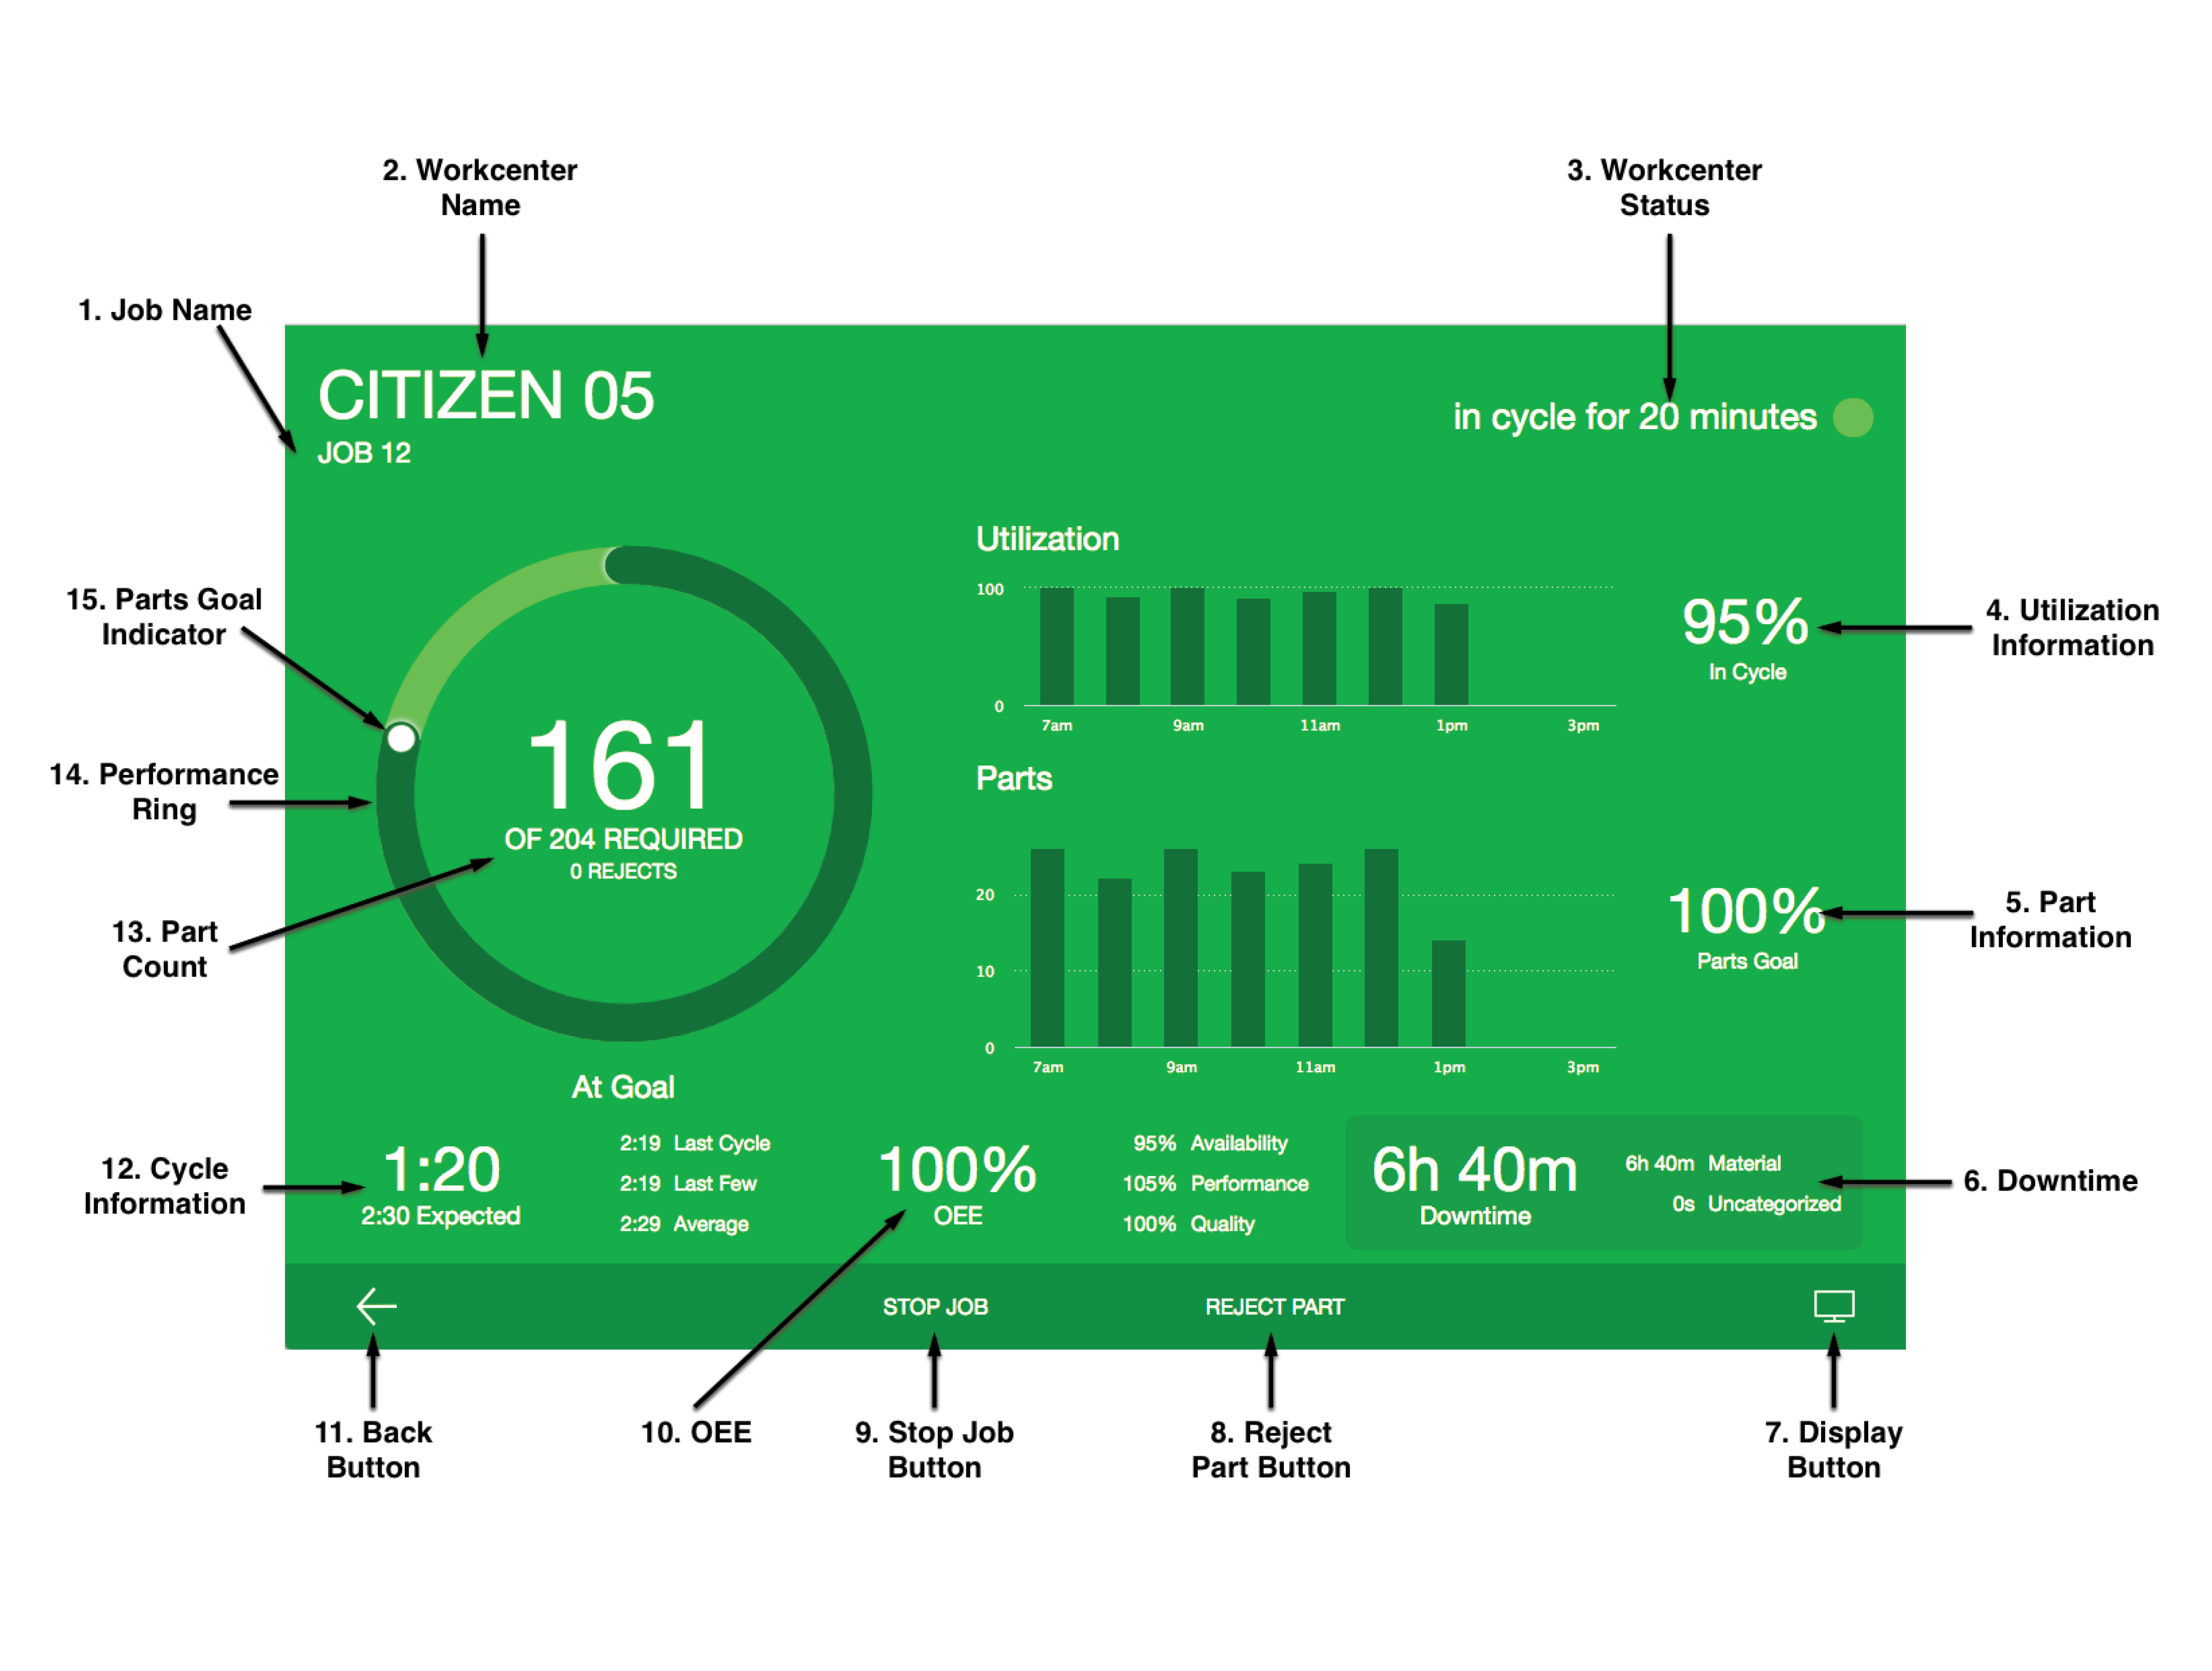
As you can see below, the Operator View visualizes a great deal of valuable information including:
As you probably know, shops will often changeover jobs frequently, and this can be the biggest source of lost production time for a business. Setup times for the same job can vary wildly by operator, or by shift. Only by tracking setup time can this be improved. Using the Operator View, MachineMetrics will track setup time by incorporating it into the workflow when dispatching jobs. After a job enters setup, the Operator View counts up to the expected setup time. All time beyond the expected setup time will be considered unplanned setup, and be visible in the downtime Pareto chart. Setup times for all workcenters are available for reporting, and that data can be exported to CSV for further analysis.
Here’s a visual of the Operator View when a workcenter is in setup:
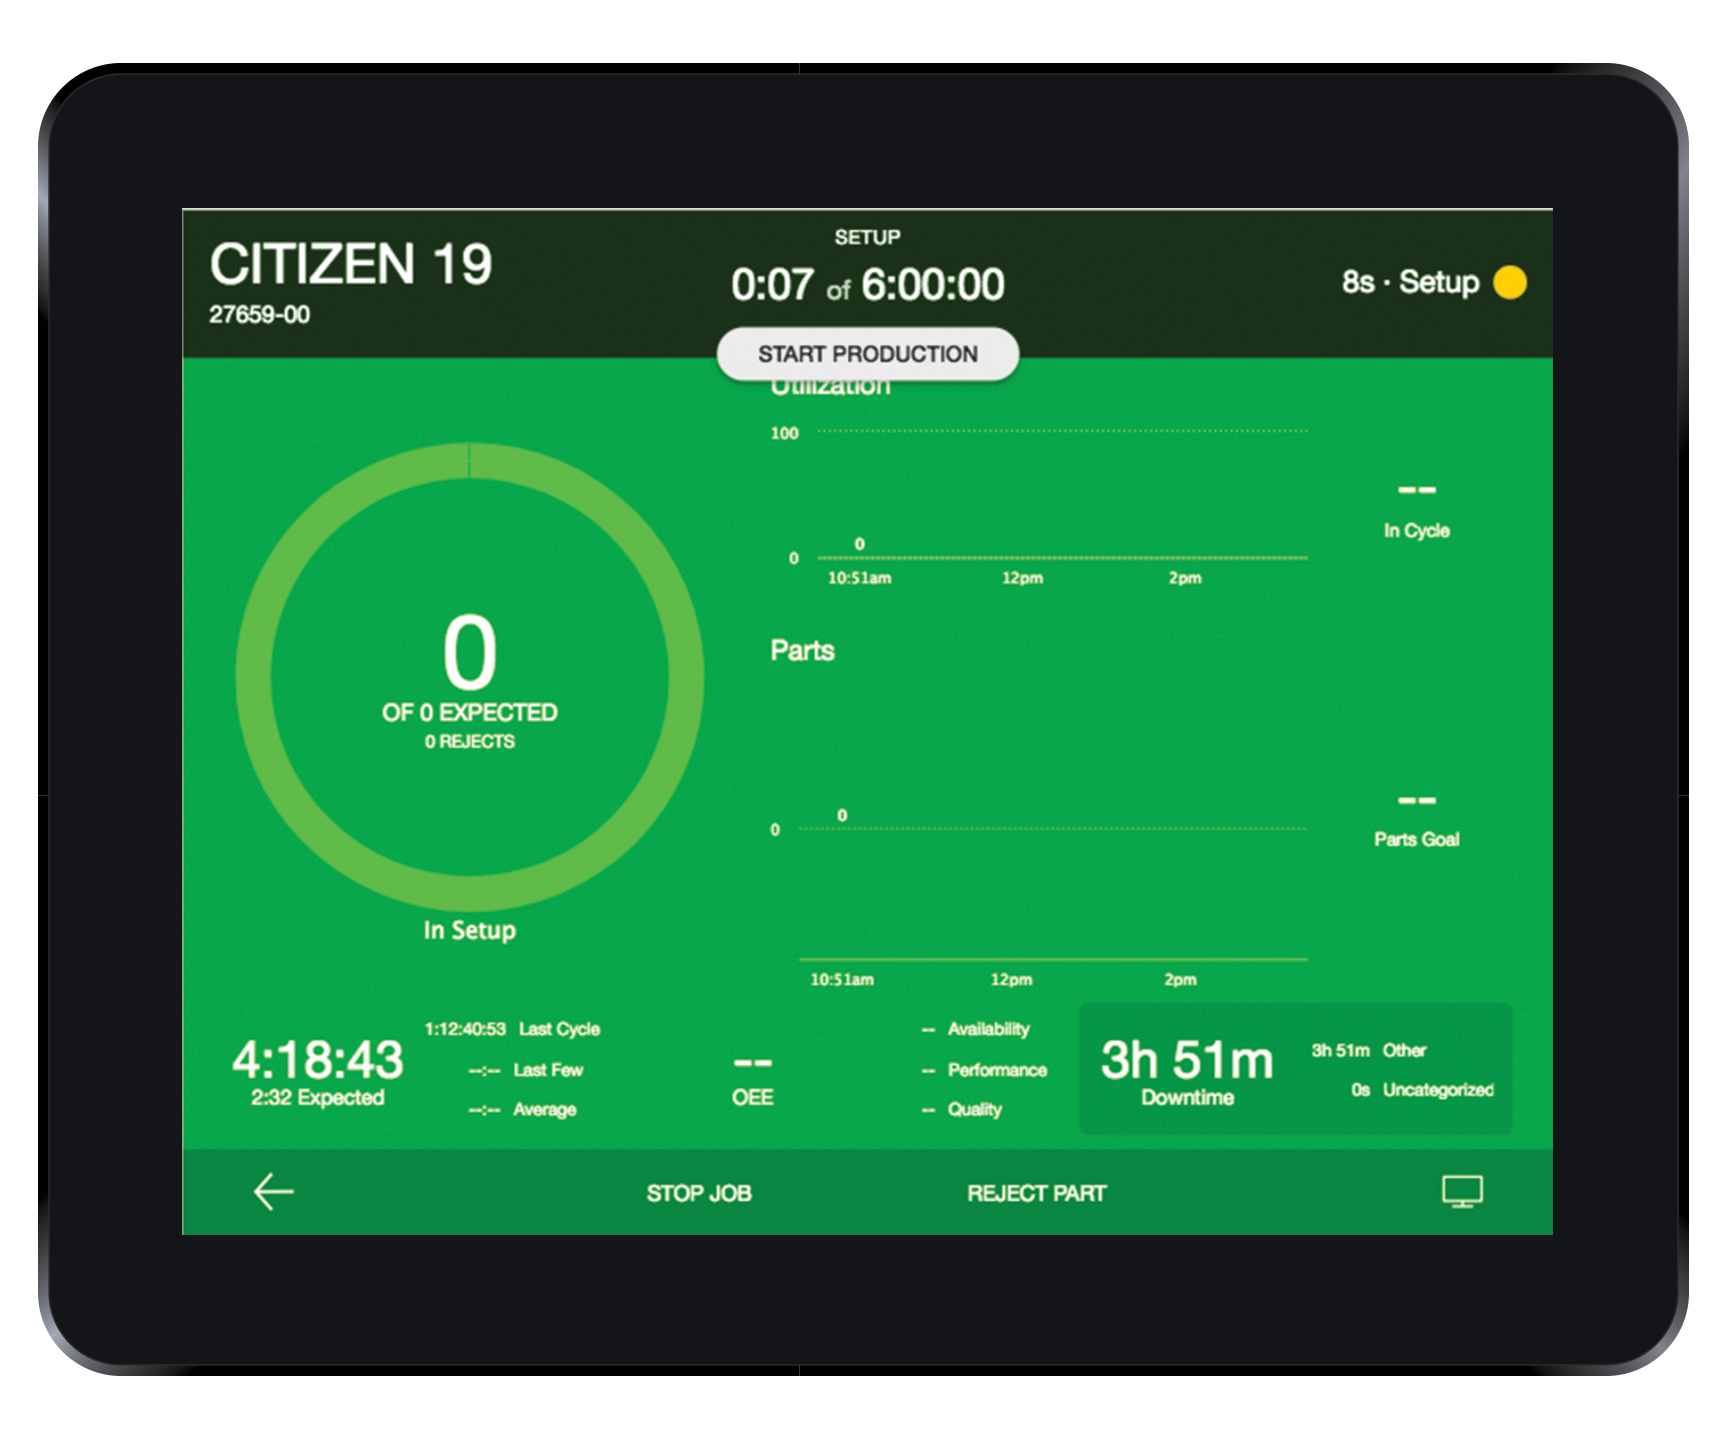
When the Operator View is displaying a workcenter in setup, a timer appears at the top of the screen displaying how long it has been in setup status and the defined setup time for this workcenter on this job. Additionally, a "Start Production" button appears that allows you to move the machine from setup to production. The data shown in this view all falls within the time range displayed on the Utilization and Parts graphs.
Just as in production, parts can be rejected and the job can be stopped. Parts goal and utilization information are not displayed when the Operator View is in setup mode and OEE is not calculated until the workcenter is moved into production.
Finally, an unscheduled workcenter displayed in the Operator View:
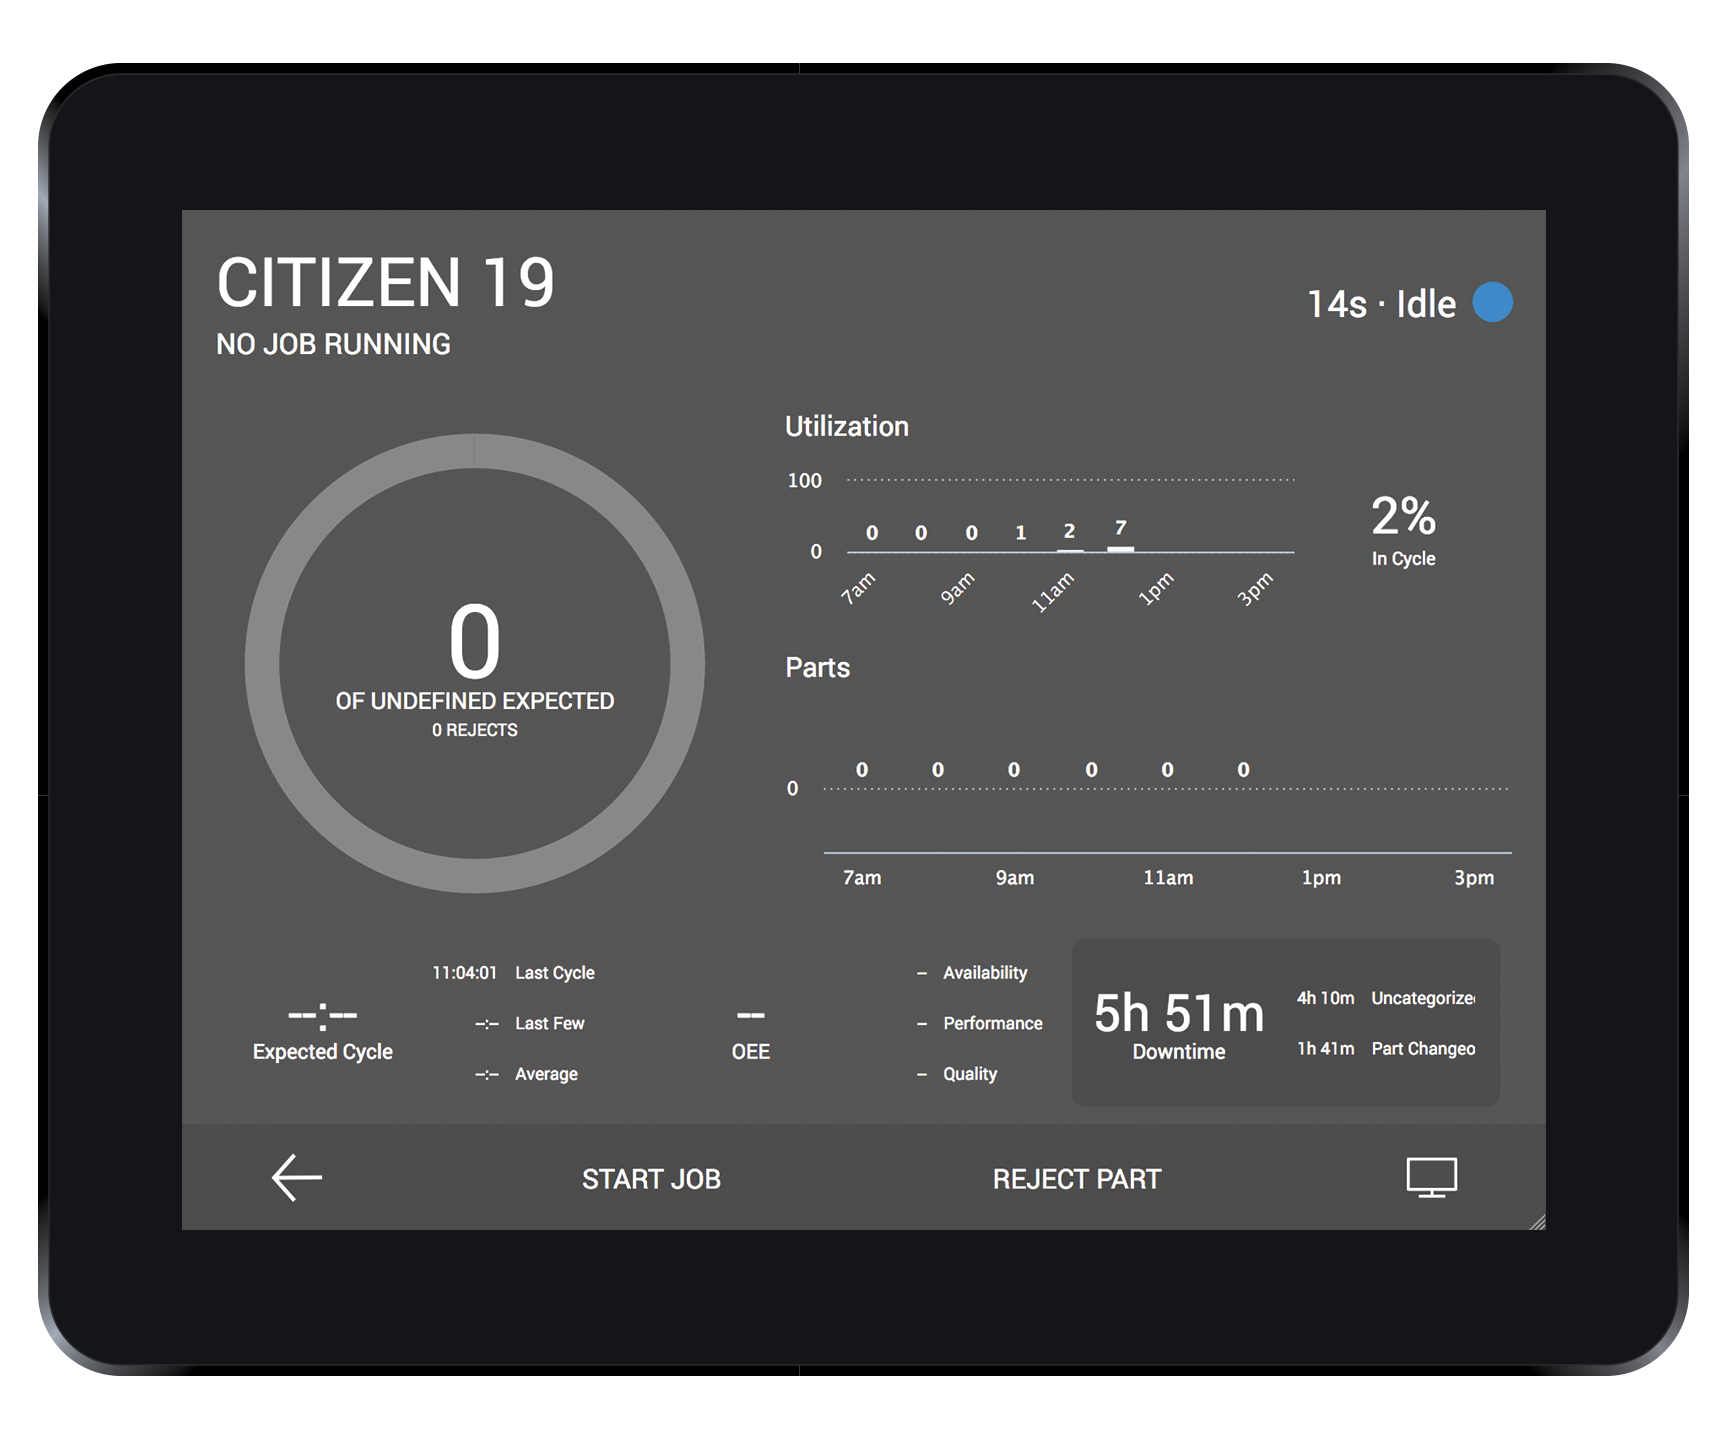
An unscheduled workcenter is one that has no jobs assigned to it. When a workcenter is unscheduled, the tile is grey and the job status is listed as "No Job Running". Although a workcenter may not have a job assigned to it, it can still be producing parts. Without a job running, any data that comes from a job will not be displayed. The performance ring will remain a light grey and no parts goal information is displayed. Expected cycle time is also not displayed; though, information about previous cycles will be shown.
In unscheduled mode, the "Stop Job" button is replaced by a "Start Job" button. When selected, this opens the Start Job screen which allows the user to select from a list of jobs this workcenter can perform and start the job. Read more about Job Dispatch.
Simply put, it’s not enough to have access to information if that information isn’t easy to digest and derive valuable insights from. Through the MachineMetrics Operator View, workcenter operators are not only able start and stop jobs but can also categorize downtime and reject parts for quality assurance, providing valuable context to the automatically collected machine data. Thus, there’s no need for the educated guessing or finger pointing that so often occurs on shop floors. Specific reasons can be attributed to each instance so you can know exactly why those issues occurred. There can be a solid reason behind everything and every decision made without the reliance on fuzzy memories or anything other than the data. The data speaks for itself.
Next week, we’ll review how to use our tablets to easily categorize downtime and help identify patterns in machine performance. Stay tuned!
Ready to empower your shop floor?
Learn More

.png?width=1960&height=1300&name=01_comp_Downtime-%26-Quality_laptop%20(1).png)


.gif)


Comments