Search
SUGGESTED CONTENT:
Despite significant investments in ERP systems, many manufacturers still struggle to manage their operations effectively. The root of the problem? A lack of accurate, real-time data from the
MachineMetrics
/ Apr 09, 2025
Customer Profile Industry: Automotive Operations: High-volume precision machining for major automotive OEMs Products: Complex machined components used in steering, driveline, and suspension systems
MachineMetrics
/ Mar 10, 2025
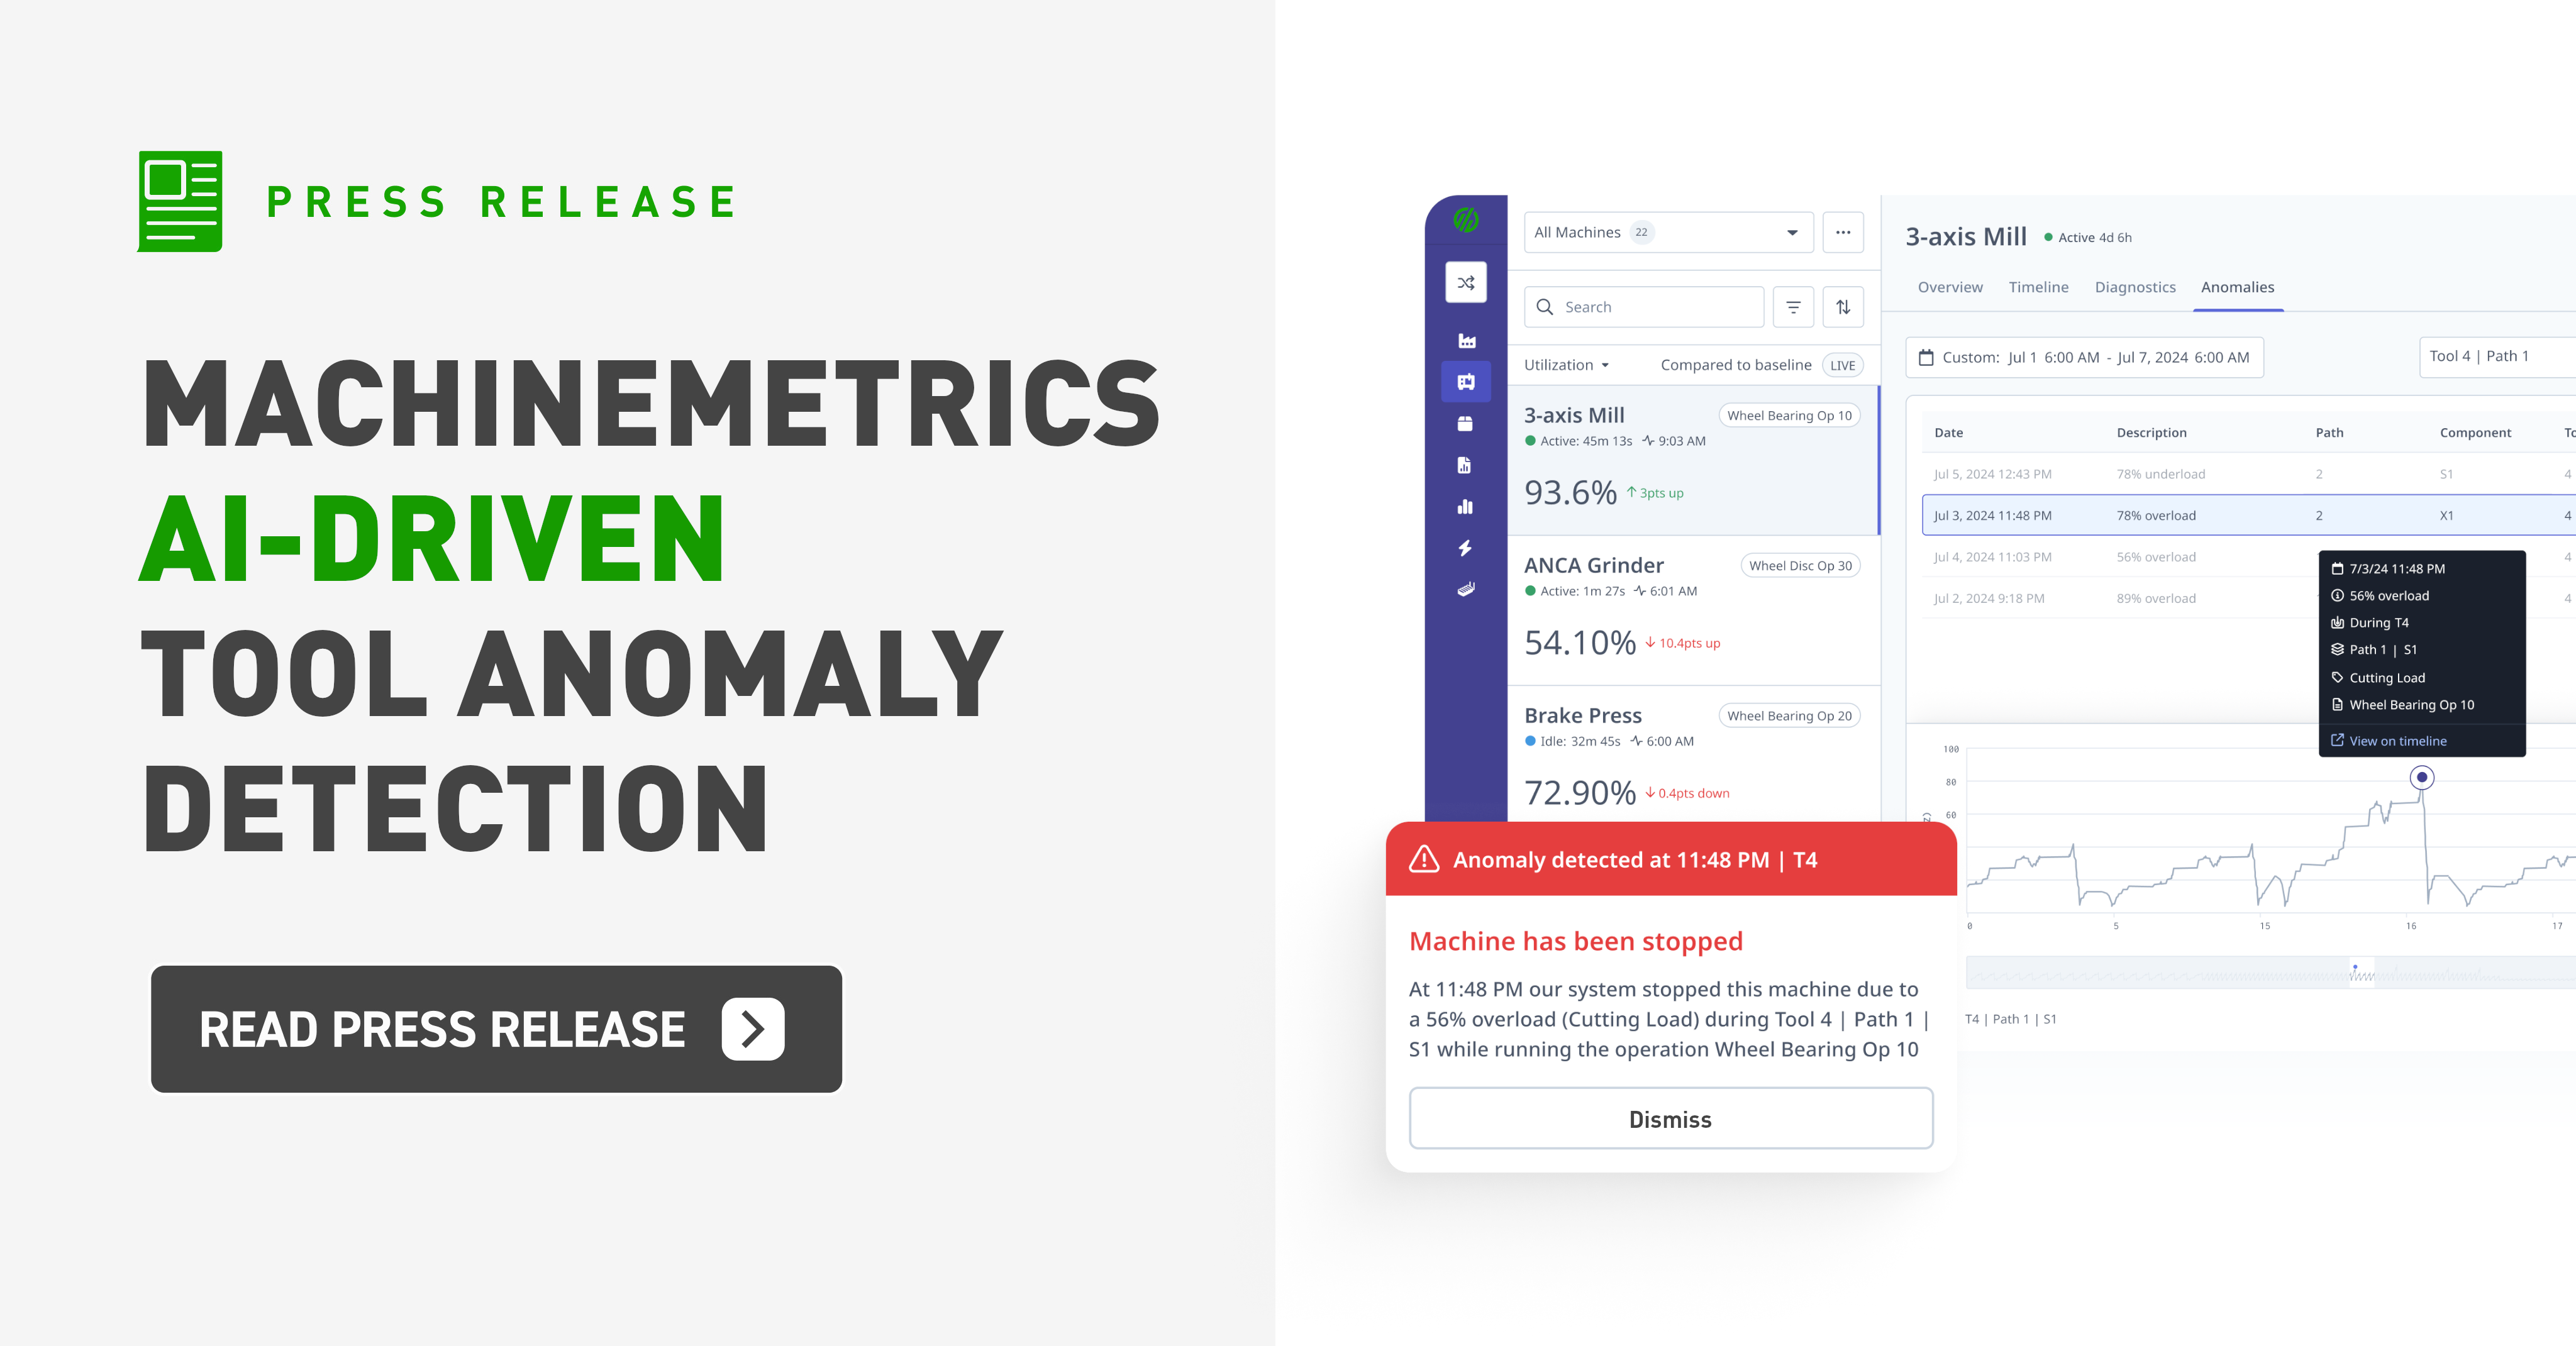
MachineMetrics, the global leader in production intelligence for discrete manufacturers, is excited to announce the launch of its groundbreaking predictive tool monitoring solution. With
MachineMetrics
/ Mar 04, 2025
We're excited to announce that MachineMetrics is now available in AWS GovCloud (US), providing manufacturers working with government contracts and defense suppliers a secure, compliant solution for
MachineMetrics
/ Feb 19, 2025
START DRIVING DECISIONS WITH MACHINE DATA.
Ready to empower your shop floor?
Learn More
.png?width=1960&height=1300&name=01_comp_Downtime-%26-Quality_laptop%20(1).png)



Comments