MachineMetrics Unveils Revolutionary Automated Schedule Intelligence Solution Read the Press Release
X
Introducing the Latest Updates

Analytics made easy

Spend less time digging through reports, and more time prioritizing the issues and opportunities available on your shop floor.
machine_overview_image_feature

Enhanced Production Insights - Personalized to Your Shop Floor

  • Machine Overview

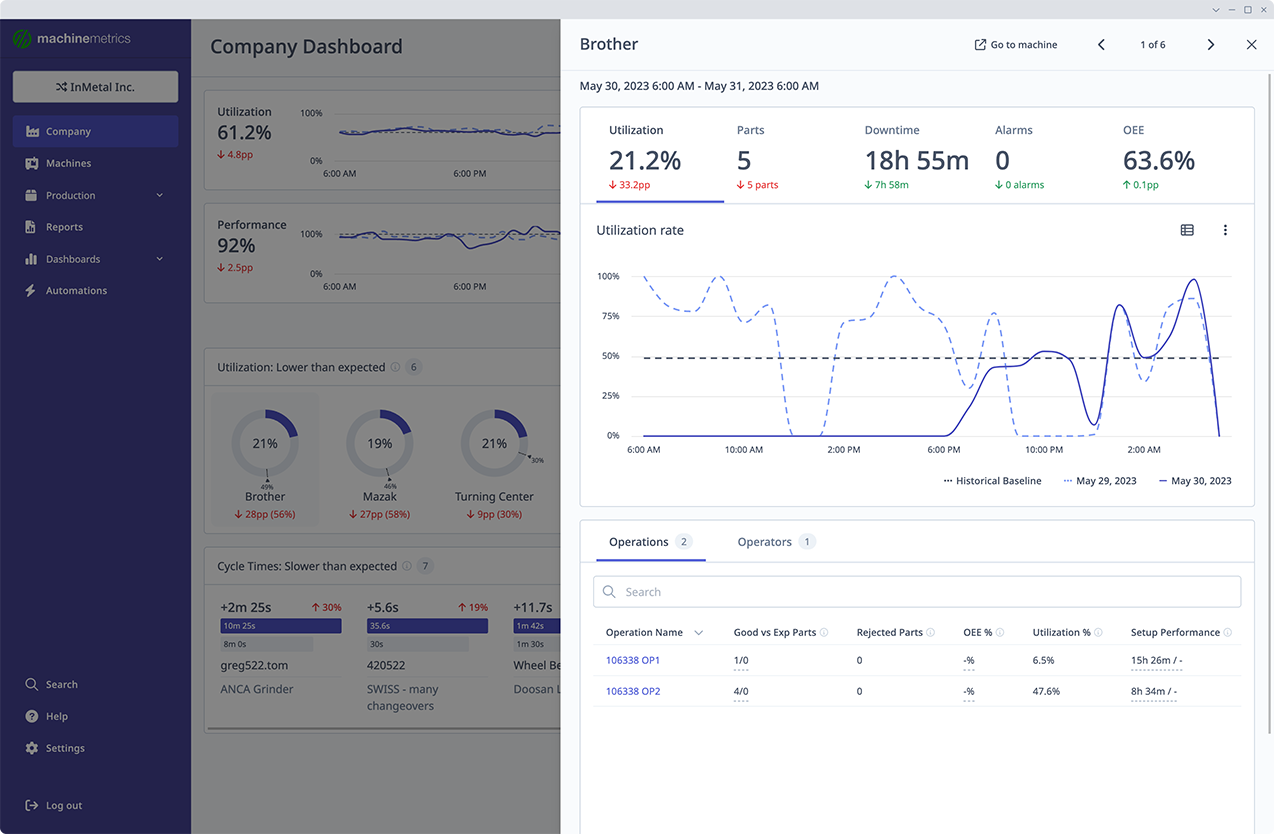
    All the data you need for a single machine in a single view. Easily switch between critical performance KPIs, view trends, and get one-click access to timelines and diagnostic information.

  • Machine Switcher

  • Custom Views

  • Easy Insights

  • Baselines

machine_overview_image_default
machine_overview_image_machine-switcher
machine_overview_image_custom-views
machine_overview_image_primary-widget
machine_overview_image_tab-zoomed

360° view of your whole company

company_dashboard_image_default
company_dashboard_image_side-sheet
company_dashboard_image_kpi-charts
company_dashboard_image_chart-modal
company_dashboard_image_top-fives
  • Company Dashboard

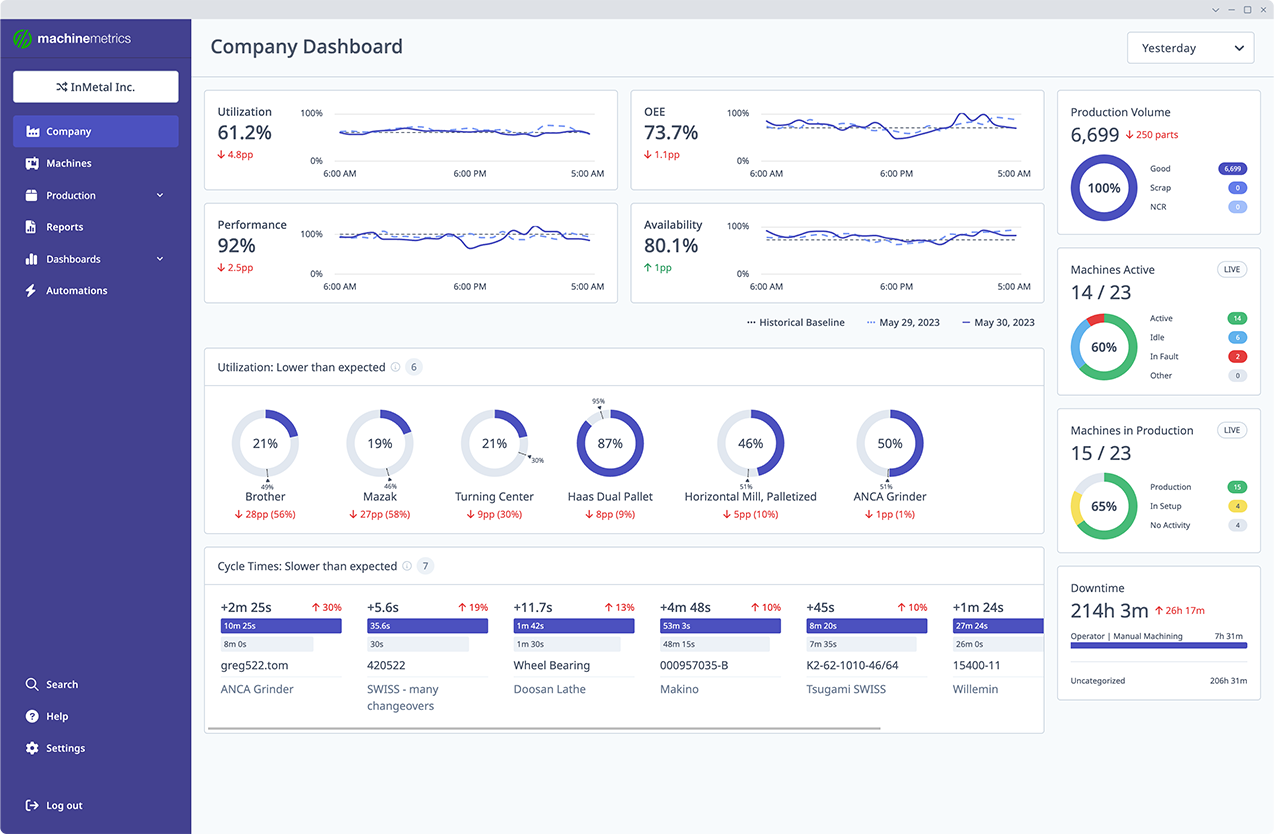
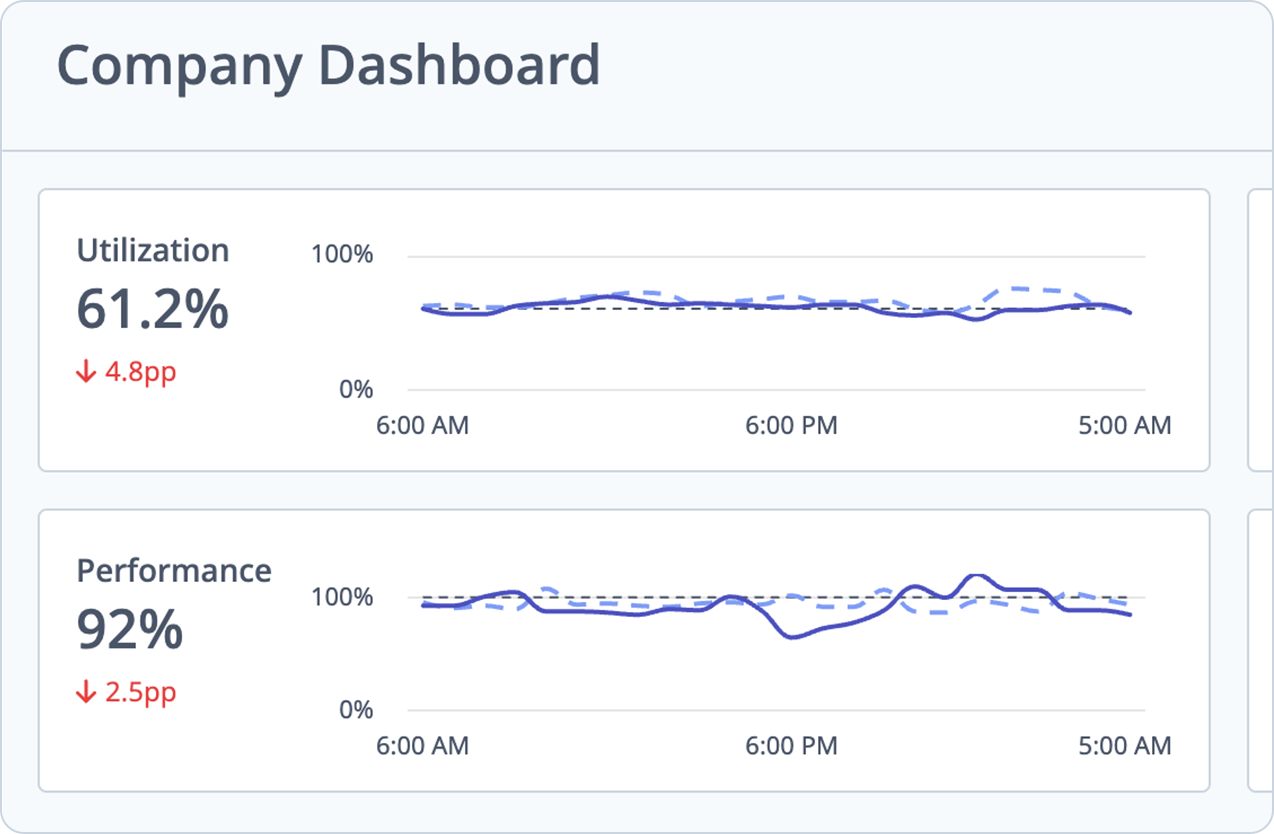
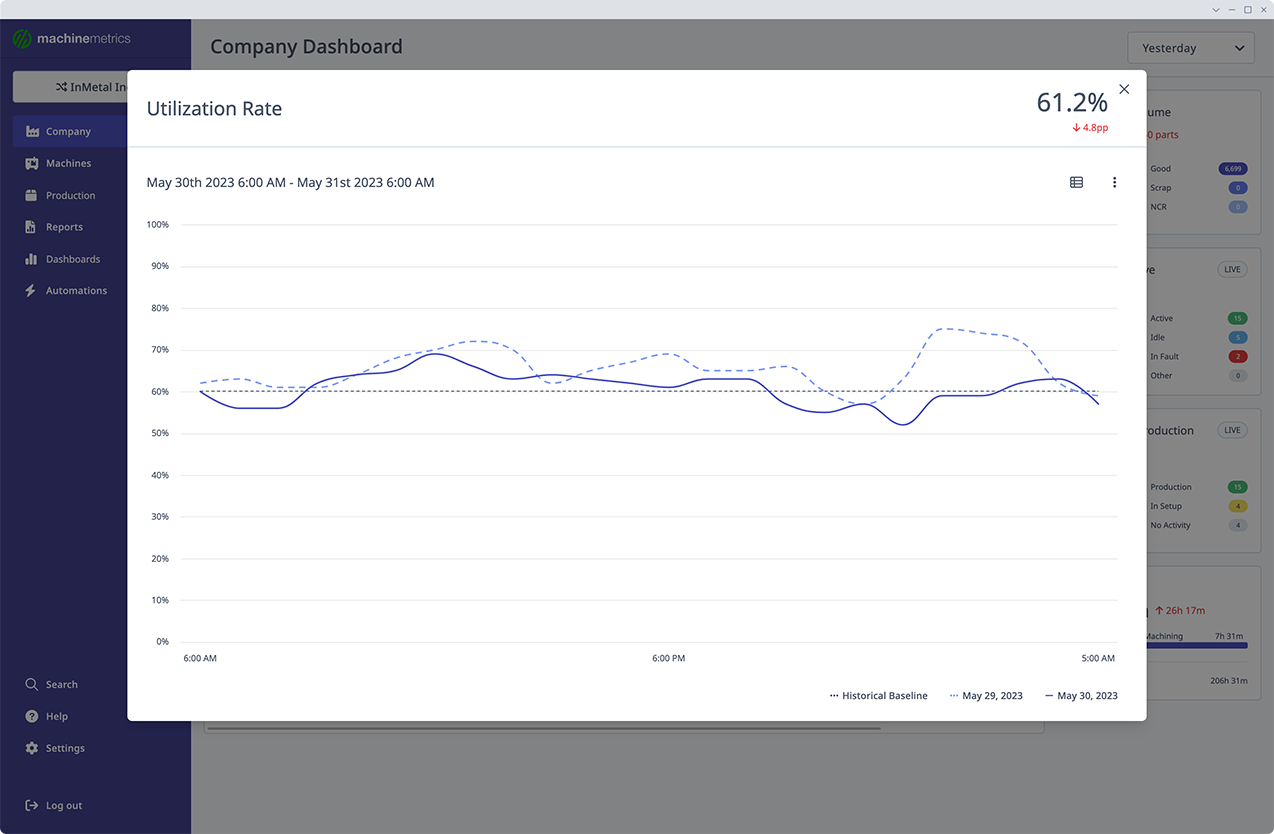
    Your one-stop shop for tracking how your machining processes are performing - organization-wide. Easily compare your performance to the statistical baseline or a previous period.

  • Drill Down Insights

  • Historical Trend Analysis

  • Real-Time Data

  • Root Cause Analysis

People MachineMetrics

With thousands of machines connected, MachineMetrics thrives off of customer feedback.
I like how the graphs are laid out and you don’t have to scroll through anything. I also like how you can quickly sift through the different machines.
Yousef Muthana
Pioneer Service
I'm able to quickly see all the details of each work center. The baseline comparisons are helpful and the way the information and layout is organized makes insights easily accessible.
Steve Jessup
VP - Planning, Roush Yates
Now I can see all the graphs and data in one place. The user experience is radically simplified.
Anthony Cicalese
Manufacturing Engineer, Thorlabs

Ready to Supercharge your shop floor?

Questions? We have answers

The Machine Overview and Company Dashboard along with a few other enhancements are expected to be released this summer.

We use the weekly median for the last 6 months to calculate the historical baseline (regardless of the date range selected).

Simply log into your account and click the Beta Features menu (the “beaker” icon to the left of the Help icon) to access all beta features.

The data for the selected date range is compared against the data from a previous period of similar duration. For example, when selecting “Today” we determine the trend/change based on the data from the previous 24 hour shop day. When selecting “Last 7 Days” we use the preceding 7 days as the comparison. For example, if the date is April 25th, and “Last 7 Days” is selected in the date picker, Apr 19-Apr 25, will be compared to Apr 12-Apr 18, 2023.

We welcome your feedback! You can access our feedback form from the Help menu. It is the question mark icon in the header navigation.

For additional training opportunities, visit our Customer Events page to register for upcoming workshops, product training sessions, and more. Many of these sessions are user-led and include live discussions where you can ask questions and get feedback.